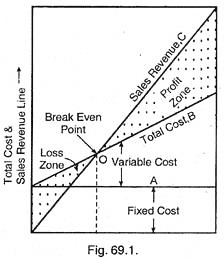
The break-even point means the level of output or sales at which no profit or loss is achieved. It indicates the position at which marginal profit or contribution is just sufficient to cover fixed overheads.
In other words, a business is said to break-even when its income equals its expenditure. When production exceeds the “Break-even point”, the business makes a profit and when it is below the “Break-even point”, the business makes loss.
This is shown in chart 69.1.:
It may be determined in terms of physical units or in money terms i.e., sales value in rupees:
ADVERTISEMENTS:
(i) Break-Even-Point in Terms of Physical Units:
Break even volume is the number of units of a product which must be sold to earn enough revenue just to cover all expenses. The break-even-point (BEP) is reached when sufficient number of units have been sold so that the total contribution margin of the units sold is equal to the fixed costs.
B.E.P = Fixed costs/Selling Price – Variable cost per unit
ADVERTISEMENTS:
(ii) Break-Even-Point in Terms of Sales Value:
Multi product firms are not in a position to measure the BEP in terms of any common unit of product. In these firms it is convenient to determine their BEP in terms of total rupee sales. In this case BEP would be the point where the contribution margin (Sales value-Variable costs) would be equal to fixed costs contribution margin is expressed as a ratio to sales.
B.E.P = Fixed costs/Contribution ratio
where, Contribution ratio = Sales value – Variable costs/Sales value
ADVERTISEMENTS:
Margin of Safety:
This is shown on the chart by the distance between B.E.P and the output being produced. It shows that if this distance is short then a small decrease in output or sales will reduce the profit greatly. If the distance is long it means the business could still be making profit after a great reduction in output.
Angle of Incidence:
By cutting sales line on to a total cost line an angle known as “Angle of Incidence” is formed. Chart shows that if the angle is large it is an indication of large profits and if it is small it shows that profit are being earned under less favourable conditions.
ADVERTISEMENTS:
Position of Break-Even Point:
If B.E.P. is over to the left of the chart with a large angle of incidence it shows that output can be raised considerably.
If B.E.P. is over to the right of the chart, the margin of safety is low, which means:
(i) The fixed overheads are too great for the amount of sales being done, and
ADVERTISEMENTS:
(ii) The fixed and variable costs are high while the profit is small.
If the production volume is below B.E.P., the company will be running in loss and beyond it profit can be had.
Break-even-point may be determined in terms of physical units or in money terms.
(i) B.E.P. in Terms of Physical Units:
ADVERTISEMENTS:
This is convenient for the single product firm. It represents the number of units of a product which must be sold to earn enough revenue just to cover all expenses.
(ii) B.E.P. in Terms of Sales Value:
Multi-product firms are not in a position to measure the B.E.P. in terms of any common unit of product. In these firms it is convenient to determine this B.E.P. in terms of total rupee sales.
