In this article we will discuss about strategic portfolio analysis, explained with the help of suitable examples.
Strategic Portfolio Analysis, alternatively termed Business Portfolio planning or Portfolio strategy or Policy-Strategy Profile or Organisational Portfolio Plan, is a broad term and refers to a technique found in many different variations.
This analytical technique helps to satisfy the emerging need for centralised decisions on key strategic issues in multinational corporations. It provides a means of comparing numerous business activities in relation to each other, establishing priorities and deciding between winners and losers.
Strategic portfolio analysis has, as its primary objective, the optimal allocation of cash resource among the various business activities comprising a diversified corporate portfolio. In addition, it can help top management decide what business activities the company should be in, how performance of the different business units should be evaluated, and who should manage these units.
The formulation of the organisational portfolio plan is the final phase of the strategic planning process. Strategic portfolio analysis assumes that most organisations, at a particular time and in reality, are a portfolio of businesses.
For example, an appliance manufacturer may have several product lines (such as TV, Refrigerators, Stereos, Washers, Dryers) as well as two divisions (consumer appliances and industrial appliances). In other words, the corporate portfolio consists of all of the businesses, product lines, divisions or other components of the parent multi-industry corporation.
Managing such groups of businesses is made little easier if resources and cash are plentiful and each group is experiencing ‘growth’ and ‘profits’. Unfortunately, providing larger and larger budgets each year to all business groups [may be Strategic Business Units (SBU’s)] is no longer feasible.
Many are not experiencing growth, and profits and/or resources (financial and non-financial) are becoming more and more scarce. In such a situation, strategic portfolio analysis helps the management make choices in the form of master strategies as well as programme strategies (included would be competitive strategies, financial strategies, and so on).
In this approach of strategic portfolio analysis, General Electric and Boston Consulting Group made pioneering contributions. General Electric introduced the concept of dividing business activities into SBU’s with like characteristics, related to the life cycles of the products.
Boston Consulting Group (BCG) deserve much of the credit for developing and popularising this analytical technique, BCG approach consisted of a wide variety of products in different growth rates, and market shares, search for investment strategies to allocate resources among them to optimise company’s long-run profits.
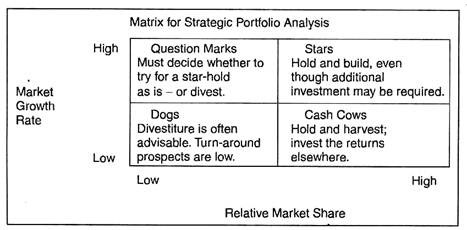
At the heart of strategic portfolio theory is the growth-share matrix shown below:
The above matrix provides a scheme for broadly classifying a company’s businesses according to their strategic needs (including cash requirements). The horizontal axis shows the relative market share held by the various SBUs, expressed as a ratio of each SBU’s share held by the leading competitor in its particular market. The vertical axis depicts the growth rate of the various markets in which the businesses compete.
A corporation, at any given time, may be comprised of several SBUs that fit into each of the four categories shown in the above matrix. Since the STARS are growing rapidly and have the advantage of already having achieved a high share of the market, they provide the firm’s best profit and growth opportunities.
The BCG believes that the only two viable strategies exist for QUESTION MARK SBU: growing the SBU into a star or divesting (getting rid of it). Since DOGS (our apologies to fellow dog lovers) hold little promise for the future and may not even pay their own way, they are prime candidates for divestiture.
In contrast, because of their high share positions in a low growth area CASH COWS are ideal for providing the funds needed to pay dividends and debts, recover overheads, and supply the funds for investment in other growth areas.
Comments:
The matrix above illustrates how companies in two well-known industries might be classified using the growth-share approach. In practice, however, portfolio matrices are used to classify various businesses for resource-allocation purposes.
Classifying businesses into a portfolio is often a very difficult task. Yet proper classification is essential in order to compete successfully in its industry. Again, for optimising resource-allocation, the development of a sound portfolio typically requires considerable analysis and negotiation by managers and staff at both the corporate and business level.
For a balanced portfolio, the cash needed by question marks must roughly equal the cash generated by cows. This equilibrium places a limit on the number of question marks a portfolio should contain.
Strategic portfolio analysis has many variants other than BCG matrix. These are profit impact on market strategy (PIMS), Experience or Learning Curve, Nine-cell General Electric matrix, Life Cycle Portfolio matrix, McKinsey’s Framework, Directional Policy matrix (DPM), Risk matrix, DPM and Risk matrix (combined three-dimensional matrix, portfolio plus risk), etc.
Strategic portfolio planning is useful in establishing performance objectives for different business units. The theory suggests that the four kinds of businesses in the growth- share matrix should be evaluated quite differently with respect to growth and profitability. It helps guide the selection of managers to head up the businesses in a company’s portfolio.
