In this article we will discuss about the concept of gap analysis, explained with the help of suitable diagrams.
In preparing the situation analysis and audit, a thoughtful forecast is usually made for sales or profits of current products as well as those that are to be added in the future. If the forecasts are not equal to the desired objectives of management, there obviously is a gap. This, sometimes, is called the ‘planning gap’. It must be filled with new strategies and policies or the aspirations of management must be lowered.
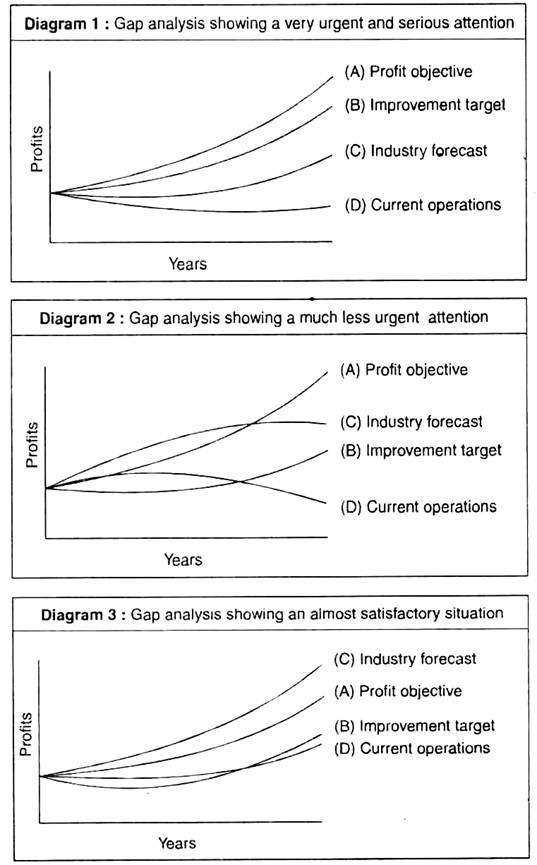
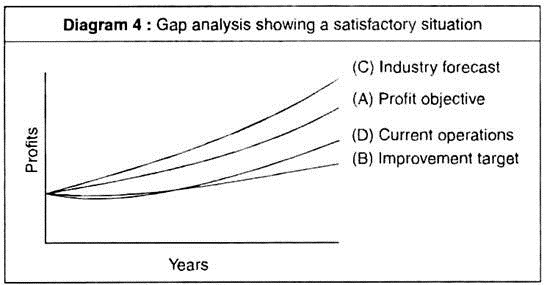
The concept is explained with the following diagrams. The absolute levels of profit are shown on the vertical axis and the time periods on the horizontal axis.
Legends for the diagram:
Line A: measures what the business wants to achieve.
Line B: measures profit target to be achieved from an improvement of strategy.
Line C: attempts to incorporate the industry trend.
Line D: measures what the company expects to achieve from its current products, assuming no basic strategic changes are made.
Analysis of the diagram:
1. The gap between the lines B and A is the ‘strategic gap’. This is the area to which corporate top management must give attention, for it will only be filled if the company enters into new strategies.
2. The movement of line D towards line A illustrates a partial closing of the ‘gap’.
3. The line C, being a forecast of trends, gives a perspective and aids the company in its assessment of the ‘improvement gap’, between the lines A and C.
4. The movement of line D towards line B (in diagram 3) and beyond line B (in diagram 4) illustrates the attainment of expected results of the various strategic programmes undertaken to fill the gap.
The ‘gap analysis’ approach to identify and initiate strategic tasks may also be used at various levels in the company and in subsidiaries. The only difference is that at the lower levels the ‘strategic gap’ may be a ‘new thinking’ gap, and it depends on how much of the strategic task is delegated by top management.

