Here is an essay on ‘Mutual Funds’ for class 11 and 12. Find paragraphs, long and short essays on ‘Mutual Funds’ especially written for college and management students.
Essay on Mutual Funds
Essay Contents:
- Essay on the Introduction to Mutual Funds
- Essay on the Types of Mutual Fund Schemes
- Essay on Mutual Funds offer Schemes with Two Options – Dividend and Growth Option
- Essay on the Calculating Returns on Mutual Fund
- Essay on the Mutual Fund Performance Evaluation with the Help of Ratios
- Essay on the Systematic Investment Plan (SIP)
- Essay on the Advantages of Mutual Funds
- Essay on the Disadvantages of Mutual Funds
Essay # 1. Introduction to Mutual Funds:
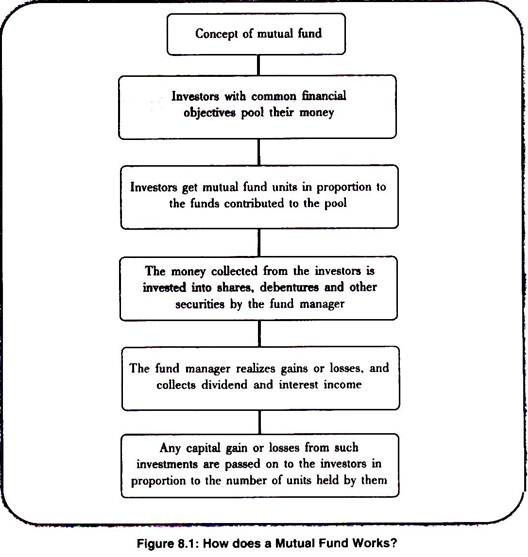
Mutual funds are money-managing institutions that pool money from the public and invest it in capital market (e.g. stocks, bonds and other securities). Such schemes are managed by Asset Management Companies (AMC), which are sponsored by different financial institutions or companies. Mutual funds issue units to the investors, which represent an equitable right in the assets of the mutual fund.
This unit has a value called as Net Asset Value (NAV). It is calculated by subtracting liabilities from the value of a fund’s securities and other items of value and dividing this by the number of outstanding shares.
So if a fund had net assets of Rs.50 lakh and there are one lakh shares of the fund, then the price per share (or NAV) is Rs.50.00.
Essay # 2. Types of Mutual Fund Schemes:
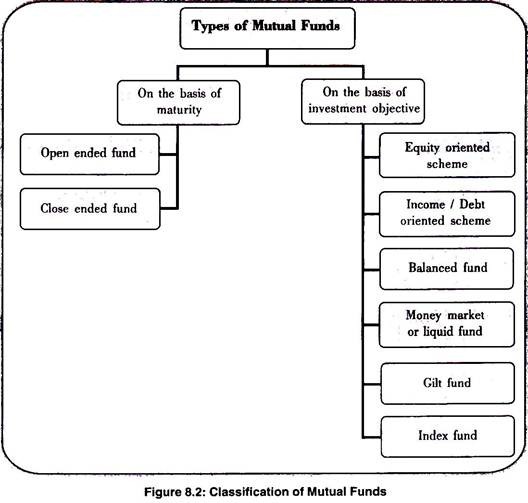
On the basis of their structure and objectives, mutual fund can be classified into various types as displayed in figure 8.2.
A. On the Basis of Maturity:
i. Open-End Funds:
Funds that can sell and purchase units at any point in time are classified as Open-end Funds. The fund size (corpus) of an open-end fund is variable (keeps changing) because of continuous selling (to investors) and repurchases (from the investors) by the fund. An open-end fund is not required to keep selling new units to the investors at all times but is required to always repurchase, when an investor wants to sell his units. The NAV of an open-end fund is calculated every day.
ii. Closed-End Funds:
Funds that can sell a fixed number of units only during the New Fund Offer (NFO) period are known as Closed-end Funds. The corpus of a Closed-end Fund remains unchanged at all times. After the closure of the offer, buying and redemption of units by the investors directly from the funds is not allowed.
However, to protect the interests of the investors, SEBI provides investors with two avenues to liquidate their positions:
1. Closed-end Funds are listed on the stock exchanges where investors can buy/sell units from/to each other. The trading is generally done at a discount to the NAV of the scheme. The NAY of a closed-end fund is computed on a weekly basis (updated every Thursday).
2. Closed-end Funds may also offer “buy-back of units” to the unit holders. In this case, the corpus of the Fund and its outstanding units do get changed.
B. On the Basis of Investment Objectives:
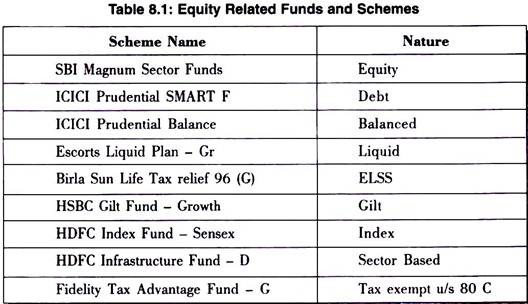
1. Equity Funds:
Such schemes normally invest a major part of their corpus in equities. Such funds have comparatively high risks. These schemes provide different options to the investors like dividend option, growth option, capital appreciation, etc. and the investors may choose an option depending on their preferences. The investors must indicate the option in the application form. The mutual funds also allow the investors to change the options at a later date.
Equity funds can also be further classified into:
(a) Sector Based Equity Funds:
These are those funds that that restrict their investments to a particular segment or sector of the economy. Also known as thematic funds, these funds concentrate on one industry such as infrastructure, banking, technology, energy, real estate, power heath care, FMCG, pharmaceuticals etc. The idea is to allow investors to place bets on specific industries or sectors, which have strong growth potential.
(b) Medium and Small Cap Equity Based Funds:
These funds invest in companies that are medium or small cap companies. Market capitalization of Mid-Cap companies is less than that of big, blue chip companies (less than Rs. 2500 crores but more than Rs. 500 crores) and Small-Cap companies have market capitalization of less than Rs. 500 crores. Market Capitalization of a company can be calculated by multiplying the market price of the company’s share by the total number of its outstanding shares in the market. The shares of Mid-Cap or Small-Cap Companies are not as liquid as of Large-Cap Companies which gives rise to volatility in share prices of these companies and consequently, investment gets risky.
(c) Large Capitalization Funds:
These funds invest in companies that are large cap companies. Market capitalization of large cap companies is more than Rs. 2500 crores.
(d) Diversified Funds:
These funds invest mainly in equities without any concentration on a particular sector(s). These funds are well diversified and reduce sector-specific or company-specific risk. However, like all other funds diversified equity funds too are exposed to equity market risk. One prominent type of diversified equity fund in India is Equity Linked Savings Schemes (ELSS). As per the mandate, a minimum of 90% of investments by ELSS should be in equities at all times. ELSS investors are eligible to claim deduction from taxable income (up to Rs1 lakh) at the time of filing the income tax return. ELSS usually has a lock-in period and in case of any redemption by the investor before the expiry of the lock-in period makes him liable to pay income tax on such income(s) for which he may have received any tax exemption(s) in the past.
(e) Value Funds:
These funds invest in companies that have sound fundamentals and whose share prices are currently under-valued. The portfolio of these funds comprises of shares that are trading at a low Price to Earning Ratio (Market Price per Share / Earning per Share) and a low Market to Book Value (Fundamental Value) Ratio.
2. Debt Oriented Schemes:
Funds that invest in medium to long-term debt instruments issued by private companies, banks, financial institutions, governments and other entities belonging to various sectors (like infrastructure companies etc.) are known as Debt / Income Funds. Debt funds are low risk profile funds that seek to generate fixed current income (and not capital appreciation) to investors.
In order to ensure regular income to investors, debt (or income) funds distribute large fraction of their surplus to investors. Although debt securities are generally less risky than equities, they are subject to credit risk (risk of default) by the issuer at the time of interest or principal payment.
3. Balance Funds:
These funds generally invest 40-60% in equity and debt instruments. These funds are also affected because of fluctuations in share prices in the stock markets. However, NAVs of such funds are likely to be less volatile compared to pure equity funds.
The aim of balanced funds is to provide both growth and regular income as such schemes invest both in equities and fixed income securities in the proportion indicated in their offer documents. These are appropriate for investors looking for moderate growth.
4. Liquid or Money Market Funds:
These funds invest exclusively in safer short-term instruments such as treasury bills, certificates of deposit, commercial paper and inter-bank call money, government securities, etc. Returns on these schemes fluctuate much less compared to other funds. These funds are appropriate for corporate and individual investors as a means to park their surplus funds for short periods.
5. Gilt Funds:
These funds invest in government papers (named dated securities) having medium to long term maturity period. Issued by the Government of India, these investments have little credit risk (risk of default) and provide safety of principal to the investors.
6. Index Fund:
These funds invest in companies that form the index and is constituted in the same proportion as the index. Equity index funds that follow broad indices (like S&P CNX Nifty, Sensex)
C. On the Basis of Load:
i. Load Funds:
Mutual Funds incur various expenses on marketing, distribution, advertising, portfolio churning, fund manager’s salary etc. Many funds recover these expenses from the investors in the form of load. These funds are known as Load Funds.
A load fund may impose following types of loads on the investors:
1. Entry Load:
It refers to the load charged to an investor at the time of his entry into a scheme. Entry load is deducted from the investor’s contribution amount to the fund.
2. Exit Load:
These charges are imposed on an investor when he redeems his units (exits from the scheme). Exit load is deducted from the redemption proceeds to an outgoing investor
ii. No-Load Funds:
All those funds that do not charge any loads are known as No-load Funds
D. On the Basis of Tax:
i. Tax-Exempt Funds:
Funds that invest in securities free from tax are known as Tax-exempt Funds. All open-end equity oriented funds are exempt from distribution tax (tax for distributing income to investors). Long term capital gains and dividend income in the hands of investors are tax-free.
ii. Non-Tax-Exempt Funds:
Funds that invest in taxable securities are known as Non-Tax-exempt Funds. In India, all funds, except open-end equity oriented funds are liable to pay tax on distribution income. Profits arising out of sale of units by an investor within 12 months of purchase are categorized as short-term capital gains, which are taxable. Sale of units of an equity oriented fund is subject to Securities Transaction Tax (STT). STT is deducted from the redemption proceeds to an investor.
Essay # 3. Mutual Funds offer Schemes with Two Options – Dividend and Growth Option:
i. Dividend Payout Option:
This option proposes to timely pay distributable surplus/profits to the investor in the form of dividends (either through cheques or ECS (Electronic Clearing Service) credits), thereby facilitating the investor to liquidate profits. The dividend option does not re-invest the profits made by the fund though its investments. Instead, it is given to the investor from time to time.
ii. Growth Option:
Under this option, the investor does not receive any dividends. Instead he continues to enjoy compounded growth in value of the mutual fund scheme, subject to the investment bets taken by the fund manager. In the growth scheme, all profits made by the fund are ploughed back into the scheme. This causes the NAV to rise over time.
There is one more option that is provided by some of the new mutual fund schemes:
a. Bonus Option:
Under bonus option the investor is not paid regular dividends. Instead he continues to receive bonus units in accordance to a ratio declared by the fund house, (very few mutual fund houses have this option).
b. The Impact on the NAV:
The NAV of the growth option will always be higher than that of the dividend option because money is going back into the scheme and not given to investors.
c. The Tax Impact:
Dividends from a mutual fund are not taxed. When the investor sells the units of a mutual fund and makes a profit, it is known as capital gain.
d. Equity and Equity Related Funds:
If you sell the units of such funds within a year of your purchase, the profit on this sale is called a short-term capital gain. It is taxed @15% on short-term capital gain. If you make a make a profit by selling the units after a year, it is called long-term capital gain. This is not taxed.
Net assets of the scheme = Market value of the investments + receivables + other accrued income + other assets – Accrued expenses – other payables – other liabilities.
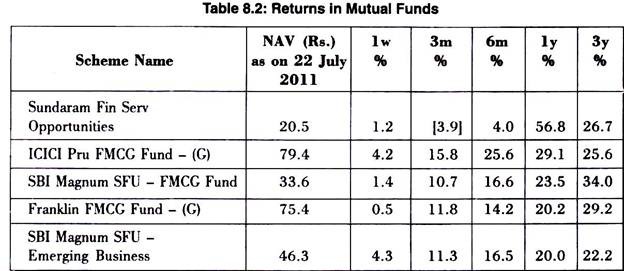
NAV is computed per unit of holding. If total assets of a scheme are Rs. 50 crores and liabilities are Rs. 10 crores and there are 2 crores unit holders, the NAV per unit is Rs. 20.
A new investor invests at the value of the existing NAV of a particular scheme. Since, investments by a Mutual Fund are marked to market, the value of the investments for computing NET ANNUAL VALUE will be at market value. NAV of Mutual Fund schemes are published on a daily basis in Newspapers and play an important role in investor’s decision to enter or exit. The NAV is used to calculate the yield on the schemes.
Essay # 4. Calculating Returns on Mutual Fund:
Investors derive income from mutual fund units in following ways:
1. Cash dividend
2. Capital gains disbursement
3. Changes in the funds NAV per unit (unrealized gain)
The one year holding period return is calculated as follows:
D = Dividend received
C = Capital Gain realized
NAV1 = Net Asset Value at the end of year
NAVo = Net Asset Value at the beginning of the year
Essay # 5. Mutual Fund Performance Evaluation with the Help of Ratios:
1. Sharpe’s Ratio:
This ratio was given by Nobel Laureate US Economist William Sharpe. It is a reward to variability ratio. It is the ratio of the risk premium to the variability of returns (standard deviation of returns).
The formula is:
Where,
rp = Expected return on the portfolio
rf = Risk free rate of return
σp= Standard deviation of portfolio return
The higher a Sharpe’s ratio, the better a portfolio’s returns have been relative to the degree of investment risk taken by the investor.
Interpretation of Value:
A ratio of 1 indicates one unit of return per unit of risk, a ratio of 2 indicates two units of return per unit of risk, and negative values indicate loss or that a disproportionate amount of risk was taken to generate a positive return.
Advantages:
i. It is a very simple measure as well as very easy to calculate
ii. It is an excellent tool to compare multiple investments that are all within the risk tolerance of the investor. Comparing the Sharpe Ratios of such investments will give an excellent idea of how much each investment is compensating for the risk as compared to the other investments.
iii. It is arguably more versatile than other metrics such as Alpha and Beta. While Beta needs to be based off a specific index and the precision of Alpha is based on a high R^2, Sharpe Ratio has no such restrictions. A Sharpe Ratio can be used to compare different types of investments (stock funds and bond funds) using the same assumptions
Limitations:
i. The Sharpe Ratio uses only the standard deviation as a measure of risk. This can be problematic when calculating the Ratio for asymmetric returns because the Standard deviation is most appropriate as a measure of risk for strategies with approximately symmetric return distributions.
ii. The Ratio formula assumes that the risk free rate is constant, but practically, it is not so.
iii. By looking at its formula, it can be seen that the ratio should decrease if we increase the risk (volatility) but that is true only when the Sharpe ratio is positive. However, with a negative Sharpe ratio, increasing risk results in a larger Sharpe ratio. Therefore, Sharpe ratio should not be used as a measure to compare portfolios that have a negative Sharpe ratio value.
2. Treynor Ratio:
This ratio was developed by Jack Treynor. It is a reward to volatility ratio. It is the ratio of the risk premium to the volatility of returns (portfolio beta).
The formula is:
Where,
rp = Expected return on the portfolio
rf = Risk free rate of return
βp = Portfolio Beta
The higher a Treynor’s ratio, the better a portfolio’s returns have been relative to the degree of market risk taken by the investor.
Advantages:
i. It measures the volatility in terms of non-diversifiable risk i.e. market risk (systematic risk).
ii. It is useful in comparing funds that invest in similar market sectors and achieve similar returns
Limitations:
i. Past beta values are used, so historical in nature.
ii. As the ratio measures the reward against systematic risk, it is not very useful for measuring returns of a less diversified portfolio with high unsystematic risk.
Note:
In a fully diversified portfolio, Treynor’s ratio would be the appropriate measure of performance evaluation. For a portfolio that is not so well diversified, the Sharpe’s ratio would be appropriate.
3. Jensen’s Alpha:
This ratio was developed by Michael Jensen. It measures the differential between the actual return earned on a portfolio and the return expected from the portfolio given its level of risk.
The formula is:
Jensen’s alpha = Return of the portfolio – Expected return (as per CAPM model)
αp Jensen’s alpha
βp Portfolio beta
rp Expected total portfolio return
rf Risk free rate of return
rm Expected market return
A positive alpha figure indicates the fund has performed better than its beta would predict. A negative alpha indicates a fund has underperformed, given the expectations established by the fund’s beta.
4. Fama’s Net Selectivity Measure:
It was developed by Eugene Fama. This value measures the overall performance of a fund. It provides an analytical framework that allows a detailed breakdown of a fund’s performance into the source or components of performance.
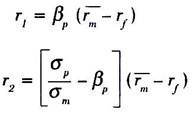
The total return of a portfolio can be broken into two broad components, risk free return and excess return. This excess return can then be broken into other components like return from market risk, return from diversifiable risk and return from pure selectivity.
Total return = Risk free return + Excess return i.e. Total return = Risk free return + (Return from market risk + Return from diversifiable risk + Return from pure selectivity)
It can be represented as:
Where,
rp = Return of the portfolio
rf = Risk free rate of Return
r1 = Return from market risk
r2 = Return from diversifiable risk
r3 = Return from pure selectivity
Substitute the above values with the following ones:
Where,
Βp = Portfolio beta
rf = Risk free rate of return
rm = Expected market return
σp = Standard deviation of portfolio return
σm= Standard deviation of market index return
By substituting, we get,
If the value of this measure is positive, it means that the portfolio manager (fund manager) has been successful in selecting the right stocks for the portfolio. If the value is negative, it is n indicator of poor performance of the portfolio manager. Thus, basically Fama’s net selectivity measure is useful in analyzing the effectiveness of the skills of the fund manager.
5. Management Expenses Ratio:
It measures the percentage of expenses that were spent to run a mutual fund scheme. It includes expenses like management and advisory fees, consultancy fees, etc. but does not include brokerage costs for trading the portfolio. A lower value is a sign of cost effective fund management.
Management expenses ratio = Expenses per unit / Average NAV
Average NAV = (NAV at beginning of year + NAV at end of year) / 2
Essay # 6. Systematic Investment Plan (SIP):
An SIP is a method of investing a fixed sum, on a regular basis, in a mutual fund scheme. It is similar to regular saving schemes like a recurring deposit. An SIP allows one to buy units on a given date each month. A SIP can be started with as small as Rs 500 per month in ELSS schemes.
Advantages of SIP:
i. Rupee Cost Averaging:
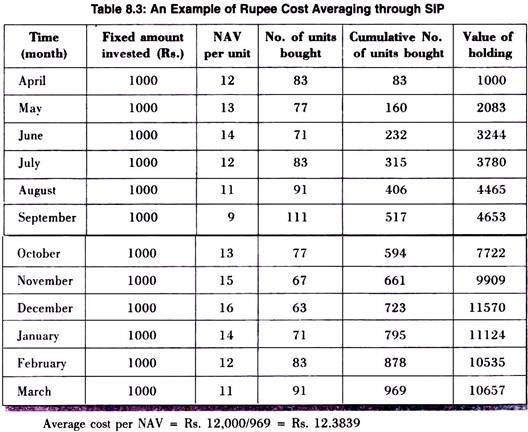
SIP minimizes the effects of investing in volatile markets. It helps in averaging out the cost by generating superior returns in the long run. It reduces the risk associated with lump sum investments. Since one get more units when the NAV drops and fewer when it rises, the cost averages out over time Thus the average cost of the investment is often reduced.
ii. Convenience and Regularity:
SIP gives the convenience to pay through Electronic clearance service (ECS) or Auto Debit. A fixed amount will automatically get debited from the account on a date specified by the investor.
iii. Disciplined Approach towards Investment:
Since the investor invests regularly, it leads to disciplined savings, which leads to wealth accumulation. Disciplined investing is vital to earning good returns over a longer time frame.
In the above table, the investor has acquired the maximum number of units when the NAV was the lowest at Rs.9 and minimum number of units when the NAV was the highest at Rs.16. Thus, it enables investors to do rupee cost averaging.
Essay # 7. Advantages of Mutual Funds:
1. Professional Management:
The primary advantage of funds is the professional management of your money. Investors purchase funds because they do not have the time or the expertise to manage their own portfolios. A mutual fund is a relatively inexpensive way for a small investor to get a full-time manager to make and monitor investments.
2. Diversification:
By owning shares in a mutual fund instead of owning individual stocks or bonds, your risk is spread out. The idea behind diversification is to invest in a large number of assets so that a loss in any particular investment is minimized by gains in others
3. Economies of Scale:
Since a mutual fund buys and sells large amounts of securities at a time, its transaction costs are lower than what an individual would pay for securities transactions
4. Liquidity:
Just like an individual stock, a mutual fund allows you to convert your shares into cash at any time.
5. Minimum Investment:
Mutual fund companies nowadays offer schemes with minimum investment as low as Rs.500 invested on a monthly basis.
6. Choice of Schemes:
Mutual funds provide investors with various schemes with different investment objectives. Investors have the option of investing in a scheme having a correlation between its investment objectives and their own financial goals. These schemes further have different plans/options.
7. Transparency:
Funds provide investors with updated information pertaining to the markets and the schemes. All material facts are disclosed to investors as required by the regulator
8. Flexibility:
Investors also benefit from the convenience and flexibility offered by Mutual Funds. Investors can switch their holdings from a debt scheme to an equity scheme and vice-versa. Option of systematic (at regular intervals) investment and withdrawal is also offered to the investors in most open-end schemes.
9. Safety:
Mutual Fund industry is part of a well-regulated investment environment where the interests of the investors are protected by the regulator. All funds are registered with SEBI and complete transparency is forced.
10. Tax Benefit:
Investors get benefit of taxes u/s 80C for investing in Equity Linked Saving Scheme.
Essay # 8. Disadvantages of Mutual Funds:
1. Professional Management:
Many investors debate whether or not the professionals are any better than you at picking stocks. Management is by no means infallible, and, even if the fund loses money, the manager still gets paid.
2. Costs:
Creating, distributing, and running a mutual fund is an expensive proposition. Everything from the manager’s salary to the investors’ statements cost money. Those expenses are passed on to the investors. Investor has to pay investment management fees and fund distribution costs as a percentage of the value of his investments (as long as he holds the units), irrespective of the performance of the fund.
3. No Customized Portfolios:
The portfolio of securities in which a fund invests is a decision taken by the fund manager. Investors have no right to interfere in the decision making process of a fund manager, which some investors find as a constraint in achieving their financial objectives.
4. Dilution:
It’s possible to have too much diversification. Because funds have small holdings in so many different companies, high returns from a few investments often don’t make much difference on the overall return
5. Difficulty in Selecting a Suitable Fund Scheme:
Many investors find it difficult to select one option from the plethora of funds/schemes/plans available. For this, they may have to take advice from financial planners in order to invest in the right fund to achieve their objectives
6. Taxes:
When a fund manager sells a security, a capital-gains tax is triggered. Investors who are concerned about the impact of taxes need to keep those concerns in mind when investing in mutual funds.
