In this article we will discuss about the utility function of investors. Also learn about indifference curves.
Utility Function and Risk Taking:
Common investors will have three possible attitudes to undertake risky course of action:
(i) An aversion to risk,
(ii) A desire to take risk, and
(iii) An indifference to risk.
The following example will clarify the risk attitude of the individual investors.
Problem:
The possible outcomes of two alternatives X and Y, depending on the state of economy are as follows:
If we assume that the three states of the economy are equally likely, then expected value for each alternative is Rs.100.
(i) A risk seeker is one who, given a choice between more or less risky alternatives with identical expected values, prefers the riskier alternative i.e., alternative Y.
(ii) A risk averted would select the less risky alternative i.e., alternative X.
(iii) The person who is indifferent to risk (risk neutral) would be indifferent to both alternative X and Y, because they have same expected values.
The empirical evidence shows that majority of investors are risk-averse. Some generalizations concerning the general shape of utility functions are possible. People usually regard money as a desirable commodity, and the utility of a large sum is usually greater than the utility of a smaller sum.
Generally a utility function has a positive slope over an appropriate range of money values, and the slope probably does not vary in response to small changes in the stock of money. For small changes in the amount of money going to an individual the slope is constant and the utility function is linear. If the utility functions linear, decision maker maximizes expected utility by maximizing expected monetary value.
Figure 3.3 shows utility functions. On this graph, person maximizes utility by maximizing EMV. Therefore, EMV, may be a useful decision criterion in the range in which the utility function is linear. But when there are large variations in the amount of money, i.e., large losses or gains at issue, the utility function ceases to be linear.
The slope of the curve will usually increase sharply as the amount of loss increases, because the dis-utility of a large loss is proportionately more than the dis-utility of a small loss, but the curve will flatten as the loss becomes very large. For a risk averse decision maker, the expected utility of a function is less than the utility of the expected monetary value.
It is also possible for the decision-maker to be risk preferring, at least over some range of the utility function. In its case the expected utility of a function is more than the utility function. In this case the expected utility of a function is more than the utility of the expected monetary value (EMV).
Indifference Curves and Attitudes to Risk:
The attitudes to risk are reflected in different relationships between utility and income. However, it does not provide a direct measure of the riskiness of any particular course of action. The most common measure of the riskiness of an action, or the risk associated with a particular financial asset is the standard deviation of the returns accruing to it.
When considering choices between alternative courses of action, decision makers may be thought of as deciding on different combinations of return on the one hand, measured by the expected value of the returns, and risk on the other, measured by standard deviation of those returns.
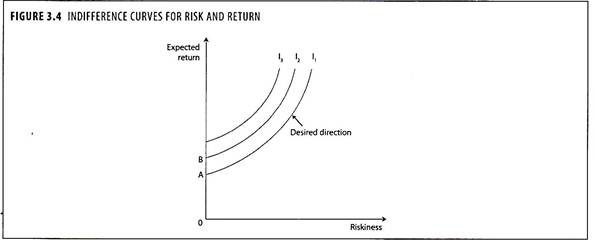
The investors attitude towards risk can be formulized by use of indifference curves which shows the trade off between risk and return. Indifference curves show the risk- return indifference for a hypothetical investor. All the points lying on a given indifference curve offer the same level of satisfaction.
In this case, indifference curves can be drawn up, showing the different combinations of risk and return which will leave an individual equally satisfied. If individuals are assumed to be risk-averse, which is the assumption generally made then the indifference curves will be as shown in figure 3.4 rising from left to right, with the more desirable combinations being as indicated by the arrow, having higher returns and lower risk.
The extent of an individual’s risk aversion will be reflected in the slopes of the indifference curves. An individual who is very highly risk averse will be prepared to sacrifice a large amount of return in order to secure a small reduction in risk and will therefore have relatively steep indifference curves, relative to one who is very highly risk averse will be prepared to sacrifice a large amount of return in order to secure a small reduction in risk and will therefore name relatively steep indifference curves, relative to one who is only slightly risk averse.
A risk neutral individual will have horizontal indifference curves. For a risk cover, for whom both risk and return are desirable characteristics, the curves will slope downwards from left to right, rather than in the other direction.


