After reading this article you will learn about:- 1. Meaning of Markov Analysis 2. Example on Markov Analysis 3. Applications.
Meaning of Markov Analysis:
Markov analysis is a method of analyzing the current behaviour of some variable in an effort to predict the future behaviour of the same variable. This procedure was developed by the Russian mathematician, Andrei A. Markov early in this century. He first used it to describe and predict the behaviour of particles of gas in a closed container. As a management tool, Markov analysis has been successfully applied to a wide variety of decision situations.
Perhaps its widest use is in examining and predicting the behaviour of customers in terms of their brand loyalty and their switching from one brand to another. Markov processes are a special class of mathematical models which are often applicable to decision problems. In a Markov process, various states are defined. The probability of going to each of the states depends only on the present state and is independent of how we arrived at that state.
Example on Markov Analysis:
A simple Markov process is illustrated in the following example:
Example 1:
A machine which produces parts may either he in adjustment or out of adjustment. If the machine is in adjustment, the probability that it will be in adjustment a day later is 0.7, and the probability that it will be out of adjustment a day later is 0.3. If the machine is out of adjustment, the probability that it will be in adjustment a day later is 0.6, and the probability that it will be out of adjustment a day later is 0.4. If we let state-1 represent the situation in which the machine is in adjustment and let state-2 represent its being out of adjustment, then the probabilities of change are as given in the table below. Note that the sum of the probabilities in any row is equal to one.
Solution:
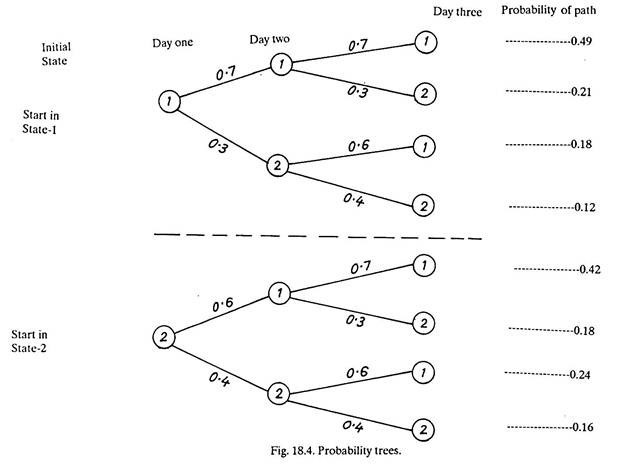
The process is represented in Fig. 18.4 by two probability trees whose upward branches indicate moving to state-1 and whose downward branches indicate moving to state-2.
Suppose the machine starts out in state-1 (in adjustment), Table 18.1 and Fig.18.4 show there is a 0.7 probability that the machine will be in state-1 on the second day. Now, consider the state of machine on the third day. The probability that the machine is in state-1 on the third day is 0.49 plus 0.18 or 0.67 (Fig. 18.4).
The corresponding probability that the machine will be in state-2 on day 3, given that it started in state-1 on day 1, is 0.21 plus 0.12, or 0.33. The probability of being in state-1 plus the probability of being in state-2 add to one (0.67 + 0.33 = 1) since there are only two possible states in this example.
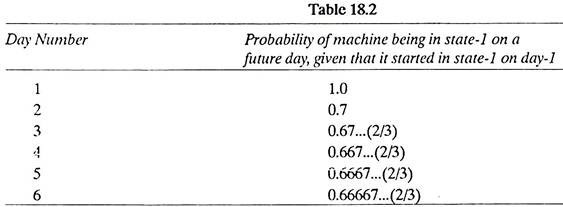
Calculations can similarly be made for next days and are given in Table 18.2 below:
Refer to Fig. 18.4 (start in State-2)
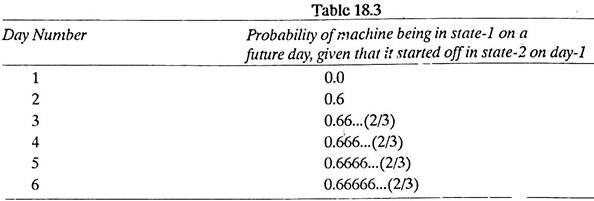
The probability that the machine will be in state-1 on day 3, given that it started off in state-2 on day 1 is 0.42 plus 0.24 or 0.66. hence the table below:
Table 18.2 and 18.3 above show that the probability of machine being in state 1 on any future day tends towards 2/3, irrespective of the initial state of the machine on day-1. This probability is called the steady-state probability of being in state-1; the corresponding probability of being in state 2 (1 – 2/3 = 1/3) is called the steady-state probability of being in state-2. The steady state probabilities are often significant for decision purposes.
For example, if we were deciding to lease either this machine or some other machine, the steady-state probability of state-2 would indicate the fraction of time the machine would be out of adjustment in the long run, and this fraction (e.g. 1/3) would be of interest to us in making the decision.
Applications of Markov Analysis:
Markov analysis has come to be used as a marketing research tool for examining and forecasting the frequency with which customers will remain loyal to one brand or switch to others. It is generally assumed that customers do not shift from one brand to another at random, but instead will choose to buy brands in the future that reflect their choices in the past.
Other applications that have been found for Markov Analysis include the following models:
A model for manpower planning,
A model for human needs,
A model for assessing the behaviour of stock prices,
A model for scheduling hospital admissions,
A model for analyzing internal manpower supply etc.


