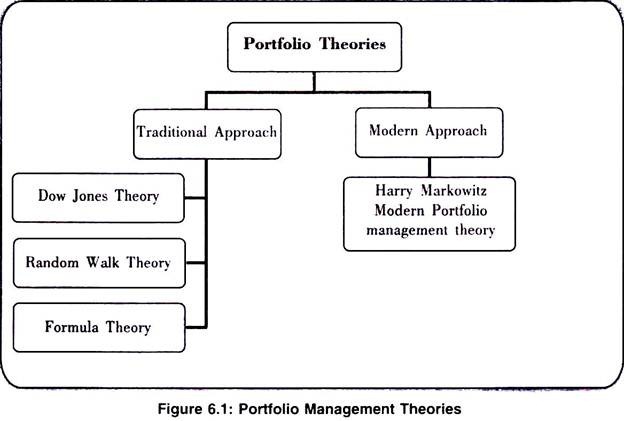
Portfolio theories guide the investors to select securities that will maximize returns and minimize risk. These theories can be classified into different categories as depicted in figure 6.1.
I. Traditional Approach:
1. Dow Theory:
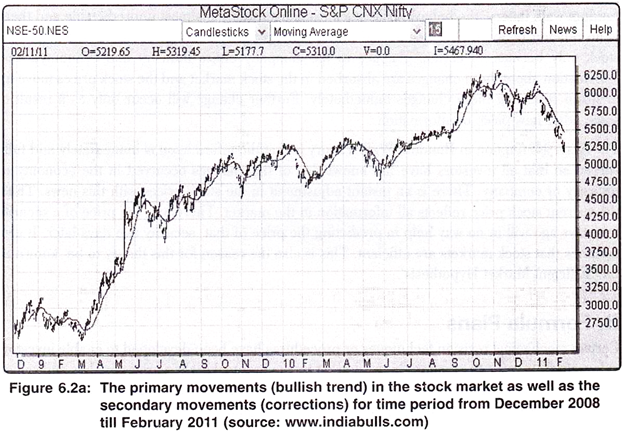
Charles Dow, the editor of Wall Street Journal, USA, presented this theory through a series of editorials. Dow formulated a hypothesis that the stock market does not move on a random basis but is influenced by three distinct cyclical trends that guide its direction. These are the primary movements, secondary reactions and minor movements.
a. Primary Movements:
These are the long term movements (from one to three years or more) of the prices of the securities on the stock exchange. Such movements can sway the entire market up or down.
b. Secondary Reactions:
These act as a restraining force on the primary movement. These are in opposite direction of primary movement and last only for a short while. These are also known as corrections.
c. Minor Movements:
These are the day to day fluctuations in the market. The minor movements are not significant and have no analytical value as they are of very short duration.
These three movements have been compared with the tides, the waves and the ripples in the ocean as depicted in figure 6.2a and 6.2b.
2. Random Walk Theory (Efficient Market Hypothesis):
According to Dow Theory, predictions can be made about the future behaviour of stock exchange prices by a careful study and analysis of the price trends. Contrary to this belief, as per the random walk theory, the behaviour of stock exchange prices is almost unpredictable and there is no relation between the present and future stock prices.
A change occurs in the price of a stock only because of certain changes in the company entire industry and economy. The information about these changes are absorbed in the stock market and the stock prices move up or down reflecting these changes immediately. Further change will occur only as a result of some other new piece of information.
The basic assumption in Random Walk Theory is that the information is immediately and fully spread so that all investors have full knowledge of the changes occurred in the economy or industry or company. There is an instant adjustment in the stock prices with this news.
Thus, the current stock price reflects all information in the market. Therefore, the price of a security two days ago will in no way help in predicting the price of that security two days later. It also assumes that stock markets are efficient. This is also the reason for this theory to be known as the ‘Efficient Market Hypothesis’.
3. Formula Plans:
Certain mechanical revision techniques or procedures have been developed to enable investors to benefit from price fluctuations in the market by buying stocks when prices are low and selling them when prices are high. These techniques are referred as formula plans. Formula plans are primarily oriented to achieve loss minimization rather than return maximization.
Formula plans possess the following features:
(a) The amount available for investment is predetermined
(b) The investor would construct two portfolios, one aggressive (equities) and the other defensive (bonds, debentures) with his investment funds.
(c) The ratio between the investments in the aggressive portfolio and the defensive portfolio would be predetermined such as 1:1 or 2:1.
(d) The portfolios are periodically monitored and adjusted accordingly
Example:
Let us assume that an investor starts with Rs. 20,000, investing Rs. 10,000 each in the aggressive portfolio and the defensive portfolio. Initial ratio is 1:1. He has predetermined the revision points as ± 20%. As share prices increase the value of the portfolio would rise. When the value of the stocks rises to Rs. 12,000, the ratio will change to 1.2:1, (i.e. 12,000:10,000). Shares worth Rs. 1,000 will be sold and the amount transferred to defensive portfolio by buying bonds. Thus, the value of both the portfolio becomes Rs.11, 000 and the ratio 1:1.
The same could be done in case if the share prices fall down. Funds could be transferred from the defensive portfolio to aggressive portfolio and the ratio can be maintained.
II. Modern Portfolio Theory:
Harry Markowitz Model Portfolio Management Theory:
This model was developed by Harry Markowitz in 1952. It analyzes various portfolios of a given number of securities and helps in selection of the best or the most efficient portfolio. Markowitz used mathematical programming and statistical analysis in order to arrange for the optimum allocation of assets within portfolio. Markowitz generated portfolios within a reward- risk context.
In other words, he considered the variance in the expected returns from investments and their relationship to each other in constructing portfolios. It is a theoretical framework for the analysis of risk return choices. Decisions are based on the concept of ‘Efficient Portfolios’.
Efficient Portfolios are those portfolios that yield the highest return for the level of risk accepted or alternatively, the smallest portfolio risk for a specified level of expected return. To build an efficient portfolio an expected return level is chosen, and assets are substituted until the portfolio combination with the smallest variance at the return level is found. As this process is repeated for other expected returns, a set of efficient portfolios is generated.
The Modern Portfolio Theory is based on following assumptions:
i. Investors estimate risk on the basis of variability of expected returns.
ii. Investors base their decisions solely on expected returns and variance (standard deviation) of returns only.
iii. For a given risk level, investors prefer high returns to lower returns. Similarly, for a given level of expected return, investors prefer less risk to more risk.
iv. Asset returns are normally distributed random variables.
v. Markets are efficient.
Explanation of Modern Portfolio Theory:
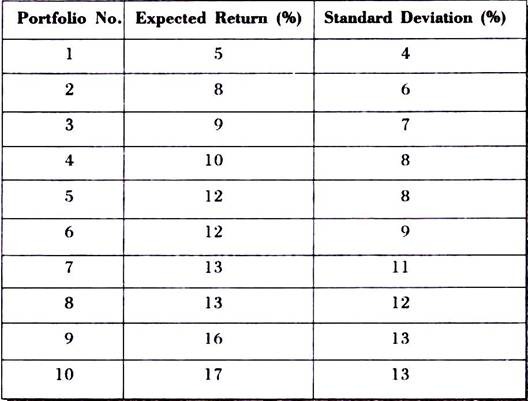
Let us assume that there are 10 portfolios with the following expected returns and standard deviation:
From the above, we can observe that in portfolio number 4 and 5, the standard deviation is same but different returns. The investor would select portfolio 5 if given a choice between 4 and 5.
Similarly, in case of portfolio number 7 and 8, the returns are same with different standard deviations. Given a choice, the investor would go for portfolio number 7.
Thus, the selection is guided by two criteria:
i. The investor would go for the portfolio with lower risk among two portfolios with same returns
ii. The investor would go for the portfolio with higher returns among two portfolios with same risk.
Shortcomings of Modern Portfolio Theory:
i. The Theory believes that it is possible to select stocks/assets which are not correlated to one another. However, it has been proved that at times, seemingly uncorrelated assets do not act/react independent of each other.
ii. The Efficient Market hypothesis is increasingly being challenged because of existence of information asymmetry, insider trading, etc.
iii. The concept of rational investors is being challenged by behavioral economists, according to whom; investors do not always behave rationally.
iv. There is no concept of risk-free asset in the real world since all assets carry some amount of inherent risk
v. It is frequently observed that the returns in equity and other markets are not normally distributed as assumed by the Theory.
vi. A large amount of input data is required for calculation. If there are N securities in the portfolio, then the investor need to obtain N variance estimates and N(N-1)/2 covariance estimates, resulting in a total of 2N + [N(N-1)/2] estimates. For example, analyzing a set of 100 securities would require 100 return estimates, 100 variance estimates and 4950 covariance estimates, resulting in a total of 5150 estimates
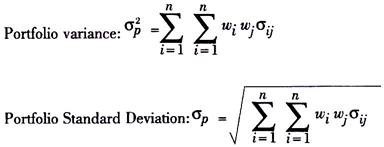
Portfolio return and Portfolio risk can be calculated as per the following formula:
Where,
σ1 and σ2 = Standard deviation of security 1 and security 2
W1 and W2 = Proportion of funds invested in security 1 and security 2
r12 – Correlation coefficient between security 1 and 2
E (R1), E (R2), E (Rn) = Expected returns on security 1, 2 and so on.
Portfolio risk (portfolio with more than two securities):
Where,
Wi = Proportion of funds invested in security i
Wj= Proportion of funds invested in security j
σij = The covariance between the pairs of securities i and j
n = total number of securities in the portfolio


