Two techniques or decision processes employed for planning and absorbing fluctuations in demand are as follows:- 1. Graphic Technique 2. Linear Programming Method.
1. Graphic Technique:
The graphic technique is simple and shows clearly the fluctuations in production demand. However, it simply compares different alternative plans and by itself does not generate optimum plan. Moreover it is a static technique.
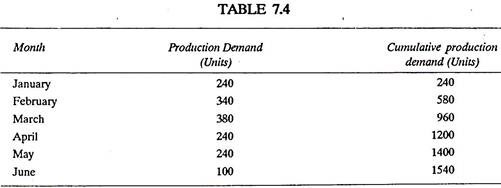
Production requirement or production demand for the individual months, from January to June and cumulative production demand from January to June have been given in the Table 7.4.
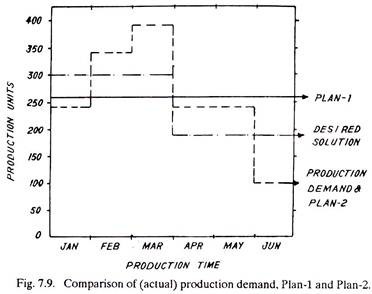
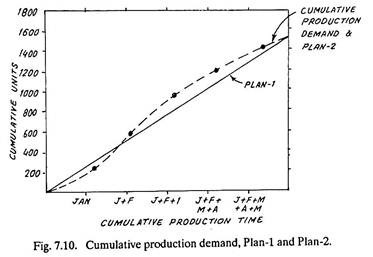
Production demands for the individual months and the cumulative production demand have been marked in the Figs. 7.9 and 7.10 respectively, in dotted lines.
ADVERTISEMENTS:
Figures 7.9 and 7.10 show two plans (namely 1 and 2) which may be employed to meet the actual production requirements; and are discussed below:
Plan-1:
ADVERTISEMENTS:
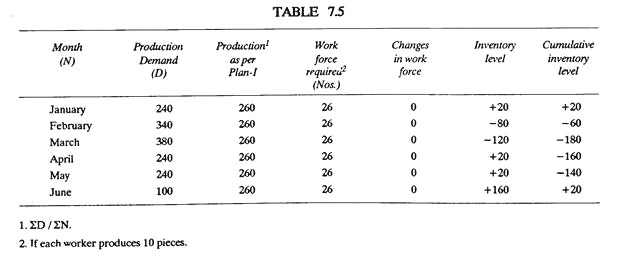
It is shown by firm line in Figs. 7.9 and 7.10. It indicates smooth (level) production rate to meet the target demand of 1540 units in 6 months. This is the simplest plan; the work force remains constant and there is no labour turn over, over time or other costs of hiring, training and work force adjustments. But, fluctuations in demand entail high inventory costs of under and over stocks. Table 7.5 shows the data as per this plan.
Plan-2:
ADVERTISEMENTS:
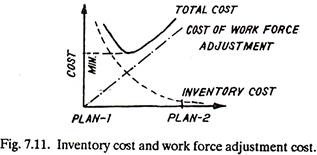
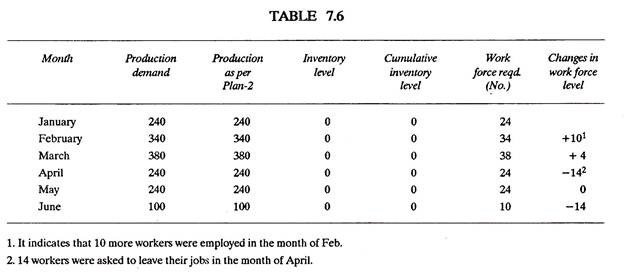
It is shown by dotted line in Figs. 7.9 and 7.10 and ii matches exactly the actual production requirements of each month. Such a plan involves high labour turn-over costs and other work force adjustment costs, but the inventory costs, move towards zero (See Fig. 7.11). Table 7.6 shows data as per this plan.
The two plans discussed above represent two extreme solutions. The desired solution will steer a path in between the two in such a way that the total cost becomes minimum (refer Fig. 7.11). The desired solution will represent some combination of, changing work force size, changing production rates, varying degrees of overtimes and subcontracting, and fluctuating inventory levels. The desired solution has been arbitrarily marked in Fig. 7.9.
2. Linear Programming Method:
ADVERTISEMENTS:
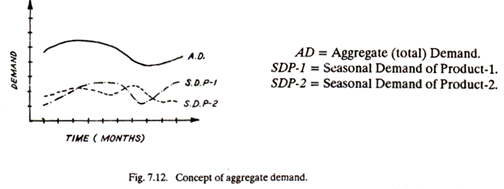
Both, the simplex and the distribution models can be employed for aggregate planning. In aggregate planning, demands are specified in aggregate quantities like total number of scooters sold in a year, etc. Figure 7.12 gives the concept of aggregate demand.
As the first step of the (Linear Programming) technique, aggregate levels are prepared and then a model is built to develop the plan. The model taken into considerations various requirements like under time, over-time, inventory, back orders, subcontracting, etc.
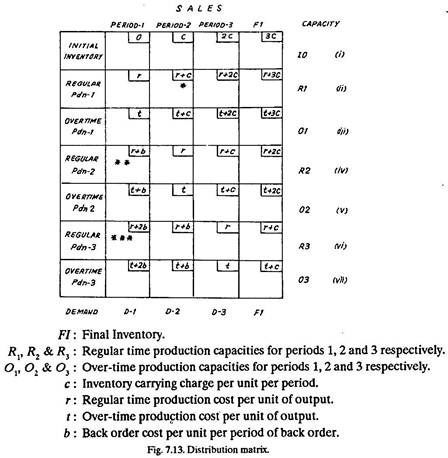
In the distribution matrix the sales requirements as well as the capacity limitations, in the form of initial inventory, regular time (production) capacity, over-time (production) capacity and sub-contracting capacity must be met. The combined (regular production, over-time production, subcontracting production and the inventory) cost is to be minimized. Figure 7.13 shows a distribution matrix for three periods of sale. Rows for subcontracting production can be added if required.
When a unit of demand in period-2 (D-2) is manufactured on regular time production of period- 1 (Regular Pdn-1) the inventory carrying cost (for that unit) is added to the production cost and thus the total cost becomes (r+c) and so on.
When demand in period-1 (D – 1) is assigned to regular time production in period-2 (Regular Pdn- 2), the back order cost b is added and thus the total cost becomes (r+b).
If the demand in period-1 is assigned to regular time production in period-3 (Regular Pdn-3) the total cost will be r+b+b = (r+2b)
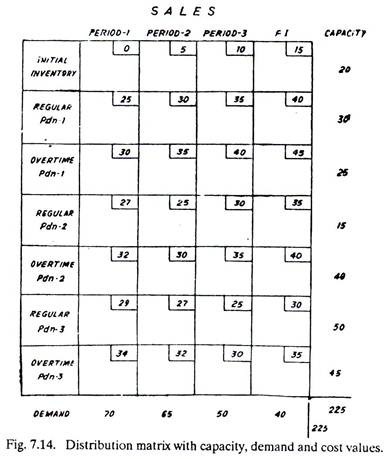
In order to find optimum solution consider the distribution matrix of Fig. 7.14 where capacities and demands have been shown along with the various cost values. The costs have been calculated by assuming that
ADVERTISEMENTS:
c = Rs. 5, r = Rs. 25, t = Rs. 30 and b = Rs. 2.
This distribution matrix can be solved by using the North-West corner method. The solution matrix thus obtained will show the number of units which should be assigned to regular production, and to over-time production in three different periods in order to minimize the total cost.
