After reading this article you will learn about:- 1. Introduction to Make or Buy Decision 2. Factors Considered for Make or Buy Decision 3. Criteria 4. Analysis 5. Procedure and Personnel Involved 6. Checklist.
Introduction to Make or Buy Decision:
Make or buy is a valid consideration in any cost reduction or product improvement programme. Advantages and disadvantages of possible alternatives should be evaluated and the choice that identifies the minimum cost makes for the final decision.
Make:
It requires appropriate production equipment, suitable personnel, material, adequate space, supervision, design standards and involves overheads, maintenance, taxes, insurances, management attention and other indirect and hidden costs.
It provides work for idle equipment and personnel utilise scrap material, shorten delivery period, permits strict adherence to the raw material specification and quality of final product. It ensures continuity of supply, may cost less than purchase and keep design and research information secret.
Buy:
Permits lower investment in facilities, smaller labour force, less handling, lower plant cost for building and upkeep, less overhead or taxes, insurance and supervision and less problems of man-management relations.
Buy permits specialisation, allows manufacture by most efficient equipment, lowers inventories, change of design without loss of investment in equipment or inventory, obtaining best price of product, and supplying more varied experience and encourages growth of ancillaries.
Whether to make or buy is sometimes referred as a purchasing function, though the decision whether to make components in one’s own factory or to buy them from market is a top management policy matter.
Theoretically, a company has choice of three alternatives before starting for a new product:
1. Purchase the product complete from a contracted manufacturer.
2. Purchase some components and materials, and manufacture and assemble the balance in its own plants.
3. Manufacture the product completely, starting with the extraction of basic raw materials.
In practice, almost no company considers the third alternative. Some companies choose the first alternative and obtain a new product completely from another company. These companies usually have no manufacturing units, but sell the product under their trade marks.
But in general, most of the companies make certain components of a product and buy others. The companies may buy a component from outside in semi-finished or complete state or buy the raw material only.
Factors Considered for Make or Buy Decision:
Factors Considered for Buying:
1. What quantities are involved?
2. Will drawings need modification?
3. Whether jigs, tools, gauges are loaned?
4. Will demand be temporary or permanent?
5. Will demand fluctuate?
6. Are special manufacturing techniques involved?
7. Is there any question of secrecy?
8. Is there a likely market elsewhere?
9. Are frequent design changes likely?
10. Arrangement for inspection, sampling etc.
11. Retention of own production personnel.
12. What notice of termination is required?
Factors Considered for Manufacturing:
1. Are patents or copy rights involved?
2. If so, what are the royalties?
3. Have the best prices been obtained?
4. Are the quantities optimized?
5. Is the previously contracted firm already making something similar which could be added to the new item, thus reducing production cost?
6. Techniques of production may be special.
7. Is raw material readily available?
8. If free material to be provided?
9. Will any tax be involved?
Criteria for Make or Buy Decision:
Companies prefer own manufacturing and buying only raw material or semi-finished parts.
Such decision is made in the following cases:
1. Finished product can be made cheaply by the firm than that by the outside suppliers.
2. Finished product only is manufactured by limited number of outside firms, which are unable to meet the demand.
3. The part has an importance for the firm, and requires extremely close quality control.
4. The part can readily be manufactured with the firm’s existing facilities and the part is similar to other items in which the company has manufacturing experience.
5. Requires high investment on facilities, which are not available at supplier’s plant.
6. Has a demand that is both stable and relatively large.
Companies will usually buy a finished part from an outside supplier when:
1. They do not have facilities to make it and there are other profitable opportunities for investing company capital.
2. Existing facilities can be used more economically to make other parts.
3. The skill of personnel employed by company is not readily available to manufacture the part.
4. Patent or other legal barriers prevent the company for making the part.
5. Demand for the part is either temporary or seasonal.
Analysis for Make or Buy Decision:
There are three types of analysis:
1. Simple cost analysis.
2. Economic analysis.
3. Break-Even-Point analysis.
1. Simple Cost Analysis:
A make or buy cost analysis involves a determination and comparison of the cost to make the part and the cost to buy it. The final make or buy decision must be based on a careful weighing of the cost considerations and various quantitative considerations.
The most difficult make-buy factors to assess are those that will significantly be affected by change in economic conditions, technological advancement, growth of the firm, or changes in the labour management relations in the future. Studies show that more mistakes are made in making what could be more profitable to bought than in buying what could more profitable to be made.
Following major elements should be involved in a ‘make or buy’ cost estimate:
To make:
1. Delivered purchased material costs.
2. Direct labour costs.
3. Any follow-on costs.
4. Incremental inventory carrying costs.
5. Incremental factory overhead costs.
6. Incremental purchasing costs.
7. Incremental managerial costs.
8. Incremental costs of capital.
To buy:
1. Purchase price of the part.
2. Transportation costs.
3. Receiving and inspection costs.
4. Incremental purchasing costs.
5. Any follow-on cost related to quality or service.
To get a clear picture, analyst must carefully evaluate these costs considering the effects of time and capacity utilisation. Cost figures must include all relevant costs, direct and indirect, and they must reflect the effect of anticipated cost changes. Since it is difficult to predict future cost levels, estimated average cost figures for the total time period in question are generally used.
Example 1:
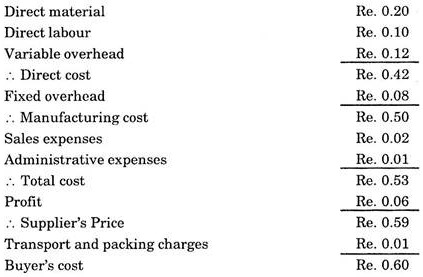
Suppose a supplier has the following unit cost of a part:
If the company likes to make this item rather than buy it could reduce the cost of part from Re. 0.60 to Re. 0.42. If the company has idle equipment that can be used to make the part and have maximum overhead expense of Re. 0.12 per unit. Further, if the company invests on additional facilities to make the part with the normal overhead, in that case if the cost of unit is equal to Re. 0.54 then it is worthwhile to make the part.
Example 2:
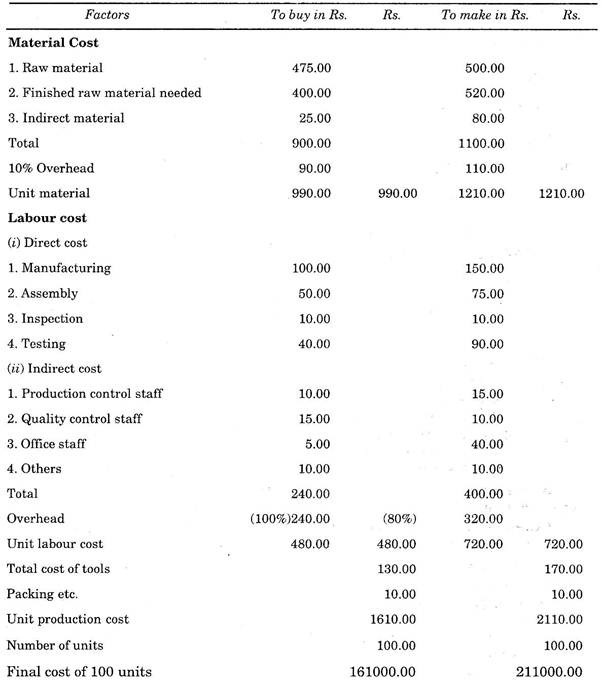
A detailed simple cost analysis is as follows:
On the basis of above cost analysis it is quite clear that the decision must be in favour of buying the part.
2. Economic Analysis:
(a) Buying:
As we know that economic purchase (ordering) quantity is equal to √2AP/C
or Q = √2AP/C
and also we know total cost = Procurement cost/year + Inventory cost per year
Total cost = A × P/Q + Q x C/2
This can further be modified by adding purchase cost/year.
Thus Total cost = A × I + A × P/Q + Q x C/2
where A = Total demand per year
P = Procurement cost per order
C = Annual carrying cost per item/year
Q = Economical purchase (ordering) quantity
I = Purchase price of one unit.
(ii) Making:
Further, it can be found out that economical production quantity is equal to
and Total cost = A × I + A × S/Q1 + C(R – A) Q1/2R
where A = Total demand per year
S = Set up cost per lot
C = Annual carrying cost per item/year
Q1 = Economical production quantity
I = Production cost per unit
R = Production rate.
By using above mentioned formulas, an economic analysis can be made in respect of make or buy decision.
This can be understood easily with the help of the following example:
Example 3:
Suppose an item has yearly demand of1000 units.
The different costs regarding make and buy are as follows:
Solution:
(a) Buying:
Economical purchase quantity = Q
Now, calculating the total cost with the help of formula,
Total cost = A × I + A × P/Q + Q × C/2
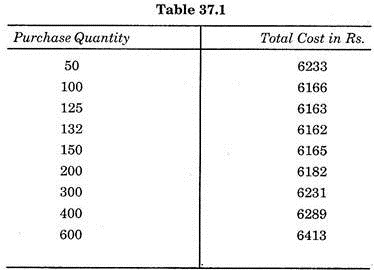
For different purchase quantities, total cost is calculated, and shown in, Table 37.1.
(b) Making:
Similarly while making we have
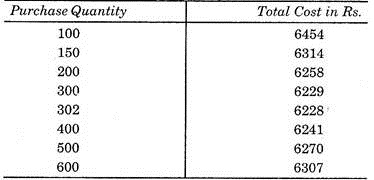
and total cost table is prepared with the help of formula
Total cost = A × I + A × S/Q1 + C(R – A) Q1/2R
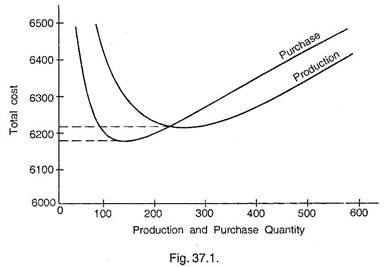
Now plotting the two tables on a graph as shown below.
The decision to buy or make may be made by analysing the minimum cost for each alternative. In this example, to buy will be the choice as by choosing this we can have saving of Rs. 66 (Rs. 6228 – Rs. 6162) per year.
Such analysis may be used for comparing alternative manufacturing facilities, or to evaluate alternate suppliers.
3. Break-even Analysis:
The decision regarding make or buy can easily be made with the help of break-even-point theory.
How the decisions are made using this theory can be easily understood with the help of following example:
Example 4:
A manufacturer of motor cycles buys spark plugs at Rs. 8 each. In case he makes it himself, the fixed and variable costs would be Rs. 10,000 and Rs. 3 per spark plug respectively. Should the manufacturer make or buy the spark plugs?
Solution:
1. Mathematical Method:
Break-even-point (B.E.P.)
= Fixed cost/Purchasing price – Variable price
= 1000/8-3 = 2000 spark plugs
Thus if the manufacturer needs more than 2000 spark plugs per year, to make is more profitable than to buy.
2. Graphical Method:
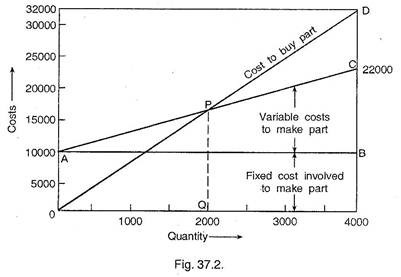
A break-even chart is drawn for solving the problem as shown in Fig. 37.2. Draw horizontal line AB at a distance to show the fixed cost involved in making a spark plug. Draw the line AC for the variable cost to make the part. When no spark plug is made there is no variable cost and when 4,000 spark plugs will be made the variable cost is Rs. 12,000. Thus the line starts from A and end at B, where total cost is equal to Rs. 10000 + 12000 = Rs. 22,000.
Draw line OD for the cost of buying the spark plug, at point A the cost of no spark plug is zero, whereas for 4000 spark plugs the cost is 8 × 4000 = Rs. 32,000.
We see that break-even-point is P, and OQ is the quantity at BEP. Thus beyond Q (2000 spark plugs) it would be cheaper to make the spark plugs than buy them. Below Q (2000 spark plugs) it would be cheaper to purchase the spark plug than to make them.
Break-Even Point Theory:
The break-even point of any two variable situations is the point or the value at which they become equal as a result of a common variable.
There are following two methods to obtain break-even point:
(a) Mathematical method.
(b) Graphical method.
(а) Mathematical method:
Let cost be the common variable in two situations 1 and 2, then cost equations will be
c1 = f1 (x)……. a function of (x) …(1)
c2 = f2 (x)…… another function of (x) …(2)
c1 — May be as total cost, annual cost, cost per item or cost per day etc. for situation 1.
c2— Same as c1 but application to situation 2.
x—a variable effecting c1 and c2.
To solve for the value of x, let c1 = c2
i.e. f1(x) = f2(x) …(3)
Equation (3) can be solved for obtaining the value of x. The value of x making the cost equal in both the situations is called “Break-Even Value”. Below this value of x one situation will be economical while above it another situation will be economical.
(b) Graphical method:
Although the break-even point may be calculated mathematically but it is usually represented graphically because it enables manager to see more clearly the break-even point and the possibilities for profits and losses. By using these charts one can predict probable profits at various levels of output.
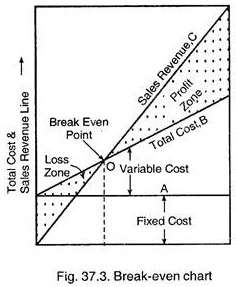
A break-even chart given in Fig. 37.3 is used to determine break-even point and amount of profit or loss under varying conditions of output of costs. Sales or expenditure in rupees is represented on vertical axis, while output (either in quantity or in percentage capacity) is represented on horizontal axis.
Line A represents the “fixed cost”, Line B represents total cost or total expenses, while line C represents sales revenue and indicates income at various levels of output. The point where lines B and C intersect each other is “Break-Even Point”. The space between lines B and C to the right of the “Break-Even Point” potential loss. The amount of loss or profit can be measured on vertical scale.
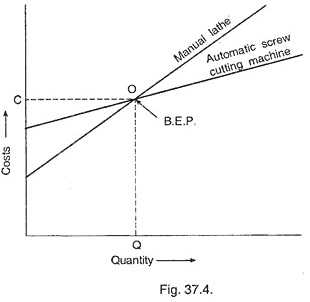
This method can be applied to various management problems. For example, suppose a manager wants to replace an old lathe machine being used for manufacturing screws by automatic screw machine. Then he must first know whether it will be profitable or not, for which he must adopt break-even point theory and construct the chart as explained in Fig. 37.4.
The figure shows that for a production less than Q, it must not be changed whereas for production more than Q automatic machine or new machine will be economical or in other words below Q manual lathe is cheaper; beyond Q, automatic machine is cheaper. This break-even point is also known as “cut-even point”.
Some Important Definitions:
(i) Angle of incidence:
It is the angle at which income line or sales line cuts the total cost line. If the angle is large, it is an indication that profits are being made at a high rate, on the other hand, if the angle is a small, it indicates that less profits are being made and are achieved under less favourable conditions.
(ii) Margin of safety:
It is the output at full capacity minus the output at “Break-Even Point”. It is expressed as percentage of output at full capacity. If the margin of safety is small, a small drop in production capacity will reduce the profit greatly.
It can also be expressed as:
(iii) Contribution:
It is the difference between sales and variable cost (marginal cost). It is also called as Marginal Profit or Gross Margin. The marginal profit provides the contribution towards fixed cost and profit.
Contribution = (Sales – Variable cost) which in turn will be equal to fixed cost + Profit.
Break-Even Point Calculations:
Let S = Sales price
V = Variable cost
F = Fixed cost
P = Profit
Now S = F + V + P
or S – V = F + P …(i)
At break-even point, P = 0
... S – V = F …(ii)
Multiplying both sides of Eq. (ii) by S.
... S(S – V) = F × S
or S = F × S/(S – V) = F/(S – V)/S = Fixed cost/Contribution per unit
and sales at B.E.P. = Rs. F × S/(S – V) …(iii)
and No. of units at B.E.P. = Fixed cost/ Contribution/unit = Fixed cost/Marginal Profit/unit …(iv)
Assumptions in Break-Even Analysis:
The various assumptions that underline in these techniques are given as under:
(i) It is assumed that over the entire range of volume of production all costs are perfectly variable.
(ii) It is assumed that over the entire range of volume of production all costs are constant fixed.
(iii) It is assumed that with the physical volume of production all revenue is perfectly variable.
(iv) The volume of sales and volume of production are equal.
(v) It is assumed that for multi-products firms, the product mix should be stable.
Whether to Add or Drop a Product Line:
In this case, following two situations which may arise should be considered:
(a) Should a new product be added in view of the estimated revenue and cost?
(b) If the product is dropped from the line, what would be the consequent effects on revenue and costs?
Example 4:
The following data from a plant is available:
Fixed cost per year = Rs. 7500
Total sales from three products = Rs. 25,000
It is decided by the management to drop the product A and add product D. To find whether the decision is profitable or not?
Assume sales for products B, C and D as Rs. 26,000.
Solution:
Total fixed cost per year = Rs. 7500.
Sales for the current year = 25,000
Product A contribution = Rs. (10 – 6) = Rs. 4
... Contribution for 20% sales of product A = 10 – 6/10 × 0.20 = 0.08
Similarly for product B, = 6 – 4/6 × 0.30 = 0.10
and for product C = 20 – 12/20 × 0.5 = 0.20
Thus contribution ratio for product A, B and C
= 0.08 + 0.10 + 0.20 = 0.38
... Total contribution of sales = 0.38 × 25,000 = Rs. 9500
... Profit = Contribution—Fixed costs = 9500 – 7500 = Rs. 2000
Similarly, the profit or contribution for new product line of products D, B, C
D = 16-6/16 × 10% = 0.06
B = 6 – 4/6 × 0.50 = 0.17
C = 20 – 12/20 × 0.40 = 0.16
... Total contribution ratio = 0.06 + 0.17 + 0.16 = 0.39
... Total contribution from sales = 26,000 × 0.39 = Rs. 10,140
... Profit = 10,140 – 7500 – Rs. 2640.
Hence proposed decision is profitable to accept.
Procedure and Personnel Involved in Make or Buy Decision:
As already said that make-buy decision is a purchase function, but by no means for such decision the material or purchase manager is wholly responsible.
Since such decisions can shape the company’s future for years to come, such decisions are always reviewed by the managers of the company. Variable factors that influence make-buy decisions are engineering factors, labour factors, material factors, space and facility factors. For decision making different experts from these fields should be consulted. A checklist as given below is quite useful in making such decisions.
Checklist for Make-Buy Decision:
1. Engineering Factors:
(i) If the product is adequately engineered?
(ii) Availability;
(a) Drawings
(b) Blueprints
(c) Specifications
(d) Bill of materials
(e) Sample, if required
2. Labour Factors:
(i) If additional manpower is needed?
(ii) If special training is needed?
(iii) If cost of tooling is considered?
(iv) If work standards are prepared?
(v) If process required for manufacturing is written?
3. Material Factors:
(i) Level of confidence in material prices.
(ii) Whether delivery dates are available?
(iii) Whether material handling has been considered?
(iv) Whether storage facilities have been considered?
(v) Whether purchasing of raw material has been considered?
(vi) Whether scrap allowance has been considered?
4. Space and Facility Factors:
(i) If capital requirement has been considered?
(ii) If space availability has been considered?
(iii) Whether necessary utilities are available?
From the managerial point of view, a systematic procedure for making such decisions should be adopted.
Such procedure should have following five requisites:
1. Provide adequate information to the decision maker.
2. Ensure that the decision maker have the background necessary to recognize and evaluate relevant data.
3. Provide a systematic way, so that proper investigation may be done.
4. Ensure that properly maintained records should be kept for future use.
5. Establish a high powered audit for all important projects after taking decision.
