This article throws light upon the six steps involved in method study. The steps are: 1. Select 2. Record 3. Critical Examination 4. Develop 5. Install 6. Maintain.
Step # 1. Select:
Select the work worth studying and define the objectives to be achieved. An objective may be to reduce the manufacturing cost, or to reduce bottlenecks or to reduce fatigue incurred by the workers in order to increase their efficiency.
Step # 2. Record:
Record all the relevant information pertaining to the existing method (if any) in details and in the form of a chart to obtain a more clear picture about the same.
Recording can be done with the help of following aids:
(a) Process Charts:
(i) Outline Process Chart:
An Outline Process Chart surveys and records an overall picture of the process and states only main events sequence-wise. It considers only (main) operations and inspections. Actually an outline process chart is the beginning of a detailed analysis.
(ii) Flow Process Chart:
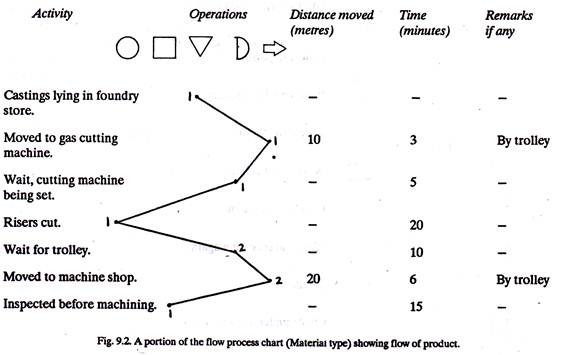
A Flow Process Chart is a detailed version of outline process chart and it records all the events. It,
(1) Sets out sequence of flow (of a procedure or product);
(2) Records all the events in sequence using process chart symbols;
(3) Marks distances travelled and time taken for completing an activity; and
(4) Mentions other important (or key) points, if any.
There are three types of flow process charts, namely:
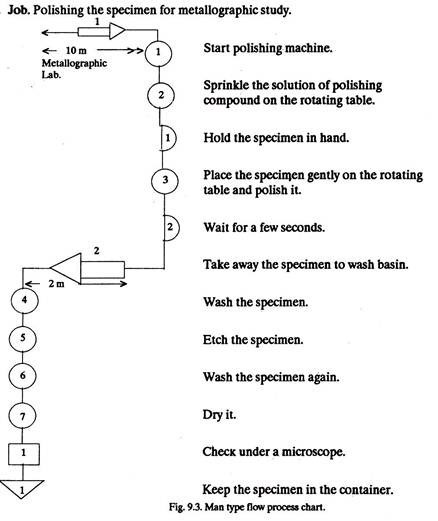
(a) Flow process chart (Man) (Fig. 9.3),
(b) Flow process chart (Equipment), and
(c) Flow process chart (Material) (Fig. 9.2).
Man Type Flow Process Chart records the activities of an operator, i.e., what an operator does.
Equipment Type Process Chart records the manner in which the equipment is used and Material Type Process Chart records what happens to the material, i.e., the changes the material undergoes in location or condition.
A flow process chart can be plotted in another manner also.
Figure 9.3 shows an example of man type flow process chart plotted otherwise:
(iii) Two Handed Process Chart:
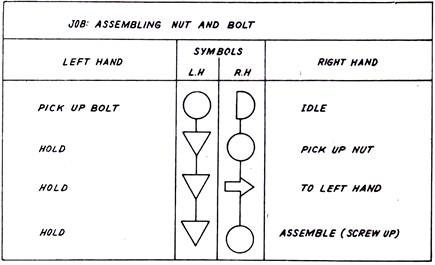
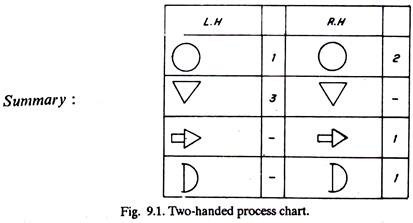
A Two Handed Process Chart records the activities of the left hand and the right hand (of an operator) as related to each other. The activities of the two hands can be synchronized by providing a time scale on the chart. Figure 9.1 shows a two-handed process chart which is also known as operator activity chart. Such a chart is generally used for repetitive works of short duration.
(iv) Multiple Activity Chart:
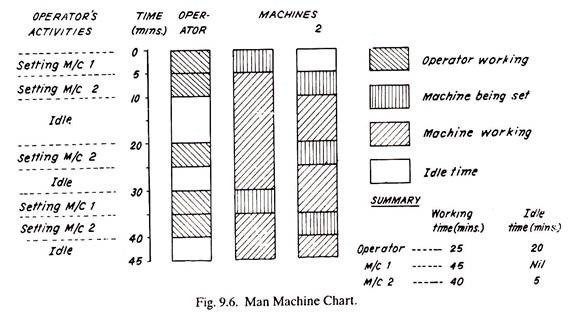
Where a number of workers work in a group or an individual operator handles two or more machines, their activities have to be co-ordinated for achieving proper results. A multiple activity chart records simultaneously the activities of all the workers and machines on a common time scale and thus shows inter-relations between them.
Purpose of Multiple Activity Chart:
(i) To detect idle times being enforced on machines and workers,
(ii) To optimise work distribution between workers and machines,
(iii) To decide number of workers in a group,
(iv) To balance the work teams,
(v) To examine the interdependence of activities, and
(vi) Ultimately, to develop an improved method of accomplishing a task and to have an effective labour cost control.
Construction of Multiple Activity Chart:
(i) A separate vertical bar or column is there to represent each subject (which may be a machine or an operator).
(ii) A common time scale is provided for all the subjects.
(iii) Activities of each subject in relation to those of the others are marked in the respective columns.
(iv) Previously conducted time studies provide the time values for each activity.
(v) A brief description of each activity is marked on the chart.
(vi) Working and idle times are marked differently on the chart.
Figure 9.6 shows a Man Machine Chart which is a specialized form of Multiple Activity Chart:
Analysis of Multiple Activity Chart:
After constructing the chart, it is tried to:
(i) Rearrange the work cycle to minimize men or machine idle times,
(ii) Simplify the operations, and
(iii) Combine or eliminate some of the elements etc.
Applications of Multiple Activity Chart:
A multiple activity chart finds applications in:
(i) Plant repair and maintenance,
(ii) Construction jobs, and
(iii) Planning team work.
Gang Process Chart:
i. Gang process chart is another type of multiple activity chart which portrays the relationship of the activities carried out by different members of a group (or gang) with respect to one another while doing a job such as riveting. The aim (of the chart) is to reduce idle and ineffective time and to improve the efficiency of the gang operations.
ii. A gang process chart looks like a man-machine chart with the difference that instead of one operator, there are a number of operators or workers.
(b) Diagrams:
(i) Flow Diagram:
In a manufacturing shop, overhauling or a repair shop or in any other department there are movements of men and materials from one location to another. Though, process charts indicate the sequence of events, they do not illustrate the movements of men, material, etc., while the work is being accomplished.
The number of movements if minimized, result in a lot of saving both in cost as well as efforts required to do a job. The path of movement (i.e., the movement between two locations and the number of times a movement is repeated) can be better visualised by drawing a diagram; it may be a string diagram or a flow diagram. A string diagram is preferred over a flow diagram, if paths of movements are very much involved (congested) and difficult to trace on a flow diagram. A flow diagram is more suitable for simple cases.
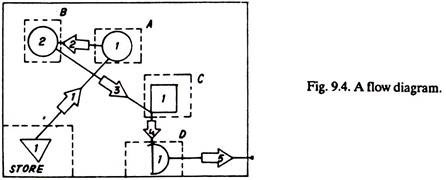
A Flow Diagram is a drawing or a diagram which is drawn to scale. It shows the relative position of production machinery, jigs, fixtures, gangway, etc., and marks the paths followed by men (workers) and materials.
Steps in drawing a flow diagram:
(1) Draw to scale the plan of the work area.
(2) Mark the relative positions of machine tools, benches, store, racks, inspection booths, etc.
(3) From the different observations, draw the actual (path) movements of the material or the worker on the diagram and indicate the direction of movement. Different movements can be marked in different colours (for better understanding). Process symbols may also be added on to the diagram.
Figure 9.4 shows a simple flow diagram, in which, raw material from the store moves to station A where an operation is performed, the semi-finished product is sent to place B where another operation is carried out, then it moves to place C for inspection, is further sent to bench D where it halts for a short while and ultimately goes out of the factory.
(ii) String Diagram:
When the paths are many and repetitive, a flow diagram becomes congested and it is neither easy to trace it nor to understand. Under such conditions a string diagram is preferred.
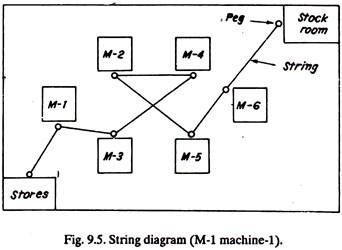
String Diagram is a model or a scale plan of the shop, in which every machine or equipment is marked and a peg or pin is struck by or in the area representing a facility. A continuous coloured thread or string traces the path taken up by the materials or workers while performing a particular operation.
Construction of String Diagram:
(i) Draw the scale-layout of the shop (working) area and mark various features, such as machinery, work benches, store, etc.
(ii) Mount this scaled drawing on a soft board and strike pins or pegs at all the places which form the path of the workers and materials. More pegs may be struck in between the facilities to trace more or less, the actual path of men and materials.
(iii) A continuous coloured unstretchable string, taken from the first to the last peg, is wound to mark the path followed by workers or materials.
(iv) As many as 15 times, a thread can be taken round each peg easily and yet it will not be difficult to comprehend the various movements. The thread when measured gives approximately the total distance travelled by a worker or the material.
Figure 9.5 shows a string diagram:
Uses of String Diagram:
A string diagram picturises the movements it:
(i) Is very useful in dealing with complex movements and plant layout and design problem,
(ii) Indicates clearly, back tracking, congestion, bottlenecks, and over and under utilised paths on the shop floor,
(iii) Measures the distances involved and points out whether a work station is suitably located,
(iv) Traces existing path of movements for necessary modifications if any,
(v) Is preferred when movements are not regular as regards their frequency and distance travelled,
(vi) Shows the pattern of movements and thus helps in deciding the most economical routes to do a particular operation,
(vii) Is advantageous in studying the movements of:
(a) An individual operator handling a number of machines,
(b) A group or gang moving from one machine or work bench to another, and
(c) Workers/materials in an assembly or repair shop.
Drawbacks of String Diagram:
If the workers or materials move in some irregular or curvilinear path, it is not possible to trace exactly the same on the string diagram and thus 1.0 estimate can be made regarding the total distance travelled by the workers or the materials.
(c) Motion and Film Analysis (Micromotion and Memomotion Studies):
(i) S.I.M.O. (Simultaneous-Motion-Cycle) Chart:
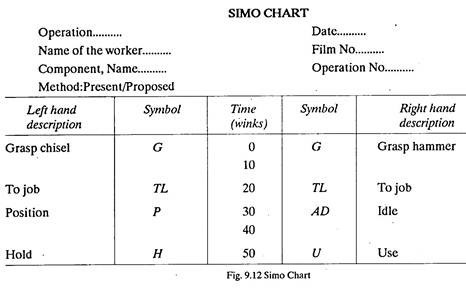
It is an extremely detailed left-and right-hand operation chart. It shows on a common time scale the simultaneous minute movements (therbligs) performed by the two hands of an operator. Besides hands, the movements of other limbs of an operator may also be recorded. The time scale is represented in winks (1/2000 of a minute).
S.I.M.O. chart is generally used for micromotion analysis of:
(a) Short cycle repetitive jobs,
(b) High order skill jobs, and finds applications in jobs like component assembly, packaging, repetitive use of jigs and fixtures, inspection, etc.
A simo chart shows relationship between the different limbs of an operator; for example, at any instant it can be found what the one hand is doing with respect to the other, in terms of therbligs. In addition to these relationships, a simo chart also records the duration of micromotions.
Construction of S.I.M.O:
(1) Using a 16-mm movie camera a number of short and repetitive work cycles are filmed (at 16 frames per second) as the worker performs the job. For recording time, a timing device (wink counter) is placed in the field of view.
(2) The film thus obtained is viewed and the most efficiently performed one whole cycle is selected for analysis. (A cycle involves complete series of motions from beginning to the end for completing a unit of work).
(3) A special projector is employed to study the work cycle recorded on the film. The work study Engineer analyses the film, frame by frame, studying one frame at a time, and concentrating first on the left-hand and then on right-hand movements.
(4) The data noted in step-3 is recorded in the form of a therblig chart. The durations of actual movements are also read from the wink counter.
(5) A simo chart (Fig. 9.12) is then drawn for further study and analysis.
(6) This simo chart of the existing method is subjected to a questioning procedure based on the principles of motion economy; the purpose is to develop a better and improved procedure for doing a job.
(7) A new Simo chart is then prepared for the new method.
(8) The new method is then checked as regards the advantages claimed for the same.
A simo chart is advantageous because it permits very accurate and detailed analysis. The work cycle from the film can be studied at ease, peacefully and away from the disturbing surroundings of the actual work place. However, the technique is limited because of the high cost of filming and analysis.
Step # 3. Critical Examination:
Examine the recorded events critically and in sequence. Critical examination involves answer to a number of questions. An activity can be eliminated, simplified or combined with another.
The basic questions are:
Purpose. – What is done?
Person. – Who does it?
Place. – Where it is done?
Means. – How is it done?
Sequence. – When is it done?
The above-mentioned five basic questions, individually are further subjected to enquiries like.
Why:
Why is it necessary, why he does it, why it is done there, why is it done by that method and why is it done at that time?
Alternative Ways of Doing:
What else could be done, who else could do it, where else it could be done, how else it could be done and when else it could be done.
Best Method of Doing:
What should be done, who should do it, where it should be done, how it should be done, and when it should be done.
Step # 4. Develop:
Develop the best method as resulted from critical examination and record it.
The developed method should be:
(i) Practical and feasible,
(ii) Safe and effective,
(iii) Economical, and
(iv) Acceptable to design, production control, quality control and sales departments.
Step # 5. Install:
Install the (best) developed method or the improved method. Installation involves three phases, namely-planning, arranging and implementing. During first two stages the programme of installation (phase-wise) and a time table, are planned and the necessary arrangements of resources, equipment, tools and instructions to workers, over-time, etc., are made.
The implementation or actual installation involves the introduction of developed method as standard practice. Problems associated with the developed method should be carefully studied and remedied, if necessary. Installation phase is complete as soon as the new method starts working smoothly and satisfactorily and gives encouraging results (like saving in time, scrap reduction, etc.)
Step # 6. Maintain:
Maintain the new method, i.e., ensure the proper functioning of the installed method by periodic checks and verifications. The purpose of checks and reviews is to find if the method being practised is the same or it has deviated from the authorised one.
Reasons for deviation if any should be explored and the necessary changes may be made in the procedure being practised so that it reverts to the authorised one. Views of the workers, supervisors and other persons related with the authorised method can be of much help in exploring further improvements.
