This article throws light upon the top fourteen tools and techniques used for statistical quality control. Some of the tools are: 1. Probability Concept 2. The Poisson Distribution 3. Normal Distribution 4. Confidence Limits 5. Measures of Central Tendency 6. Estimation 7. Significance Testing 8. Analysis of Variance 9. Control Charts 10. Life Testing 11. Reliability and Reliability Prediction and Few Others.
Technique # 1. Probability Concept:
The probability concept is important for an Industrial Engineer as it forms the basis of statistical quality control. The understanding of the probability theory becomes necessary in order to follow sampling Inspection and operation of control charts. Though there does not seem to be a commonly agreed precise definition for probability, generally speaking, there should be a numerical scale to make consistent measurements for comparing the probabilities of two or more occurrences.
A probability generally refers to totality of possible occurrences. A probability is a mathematical measure of the likelihood of an occurrence. If m be the number of times a specific event occurs and n is total equally likely results of the trial, the probability of occurrence of this event is m/n. For example, if a bag contains 100 balls, 50 red and 50 black, and one ball at random is picked through the bag, the probability that it will be a red ball is 50/100 = 0.5 and the probability that it will be a black ball is again 50/100 = 0.5.
Addition Law of Probability:
If events are mutually exclusive, that is, only one event can occur at a time, and the probability of occurrence of first event is p1 of second event p2 then the probability p of occurrence of first or second event is equal to p1 + p2, i.e., p = p1+ p2 and also the sum of the probabilities of all such (mutually exclusive) events is equal to one.
Taking the same example (as above) of a bag containing 50 black and 50 red balls, the probability of picking a red ball, p1= 50/100 = 0.5; the probability of picking a black ball, P2= 50/100 = 0.5 ; thus according to Addition Law of Probability, the probability p of occurrence of first event or second event is 0.5 + 0.5 = 1 that means there is full certainty or 100% probability or surety of occurrence of either of the two events, which is correct because there are balls of only two colours, red and black (in the bag). Moreover, the sum of probabilities of all mutually exclusive events should be = 1, which is also true.
Multiplication Law of Probability:
According to this law, unlike that of addition, the events are mutually independent (and not mutually exclusive). Therefore, under this condition, the probability of the events occurring together or in a particular order is given by the product of the individual probabilities of the events.
Example 1:
If 4 dice (each having six faces and corresponding numbers 1 to 6 marked on them) are thrown, calculate the probability that all dice will show odd numbers (i.e., 1, 3 or 5).
Solution:
Out of sue numbers, three are odd, i.e., 1, 3, 5 and three are even, i.e., 2, 4 and 6. Thus, the probability of occurrence of an odd number in each dice is 3/6 = 0.5. An odd number can occur on any dice or on all dice. Thus the probability that all the four dice will show odd numbers is
0.5 x 0.5 x 0.5 x 0.5 = 0.0625.
The laws of probability explained earlier are related to single trials, i.e., when one ball is drawn from the bag at a time and before conducting the next trial it (previously drawn ball) is put in the bag again.
If, however, instead of taking out one piece (ball), one has to draw a number of pieces at a time as in sampling inspection the following treatment will hold good provided a small number of pieces or components are drawn (for inspection) from a large batch or lot.
Sampling:
It means drawing a small number of components, for inspection, from a large size batch.
Assume a batch contains 10,000 piston pins out of which 150 are defective. A sample of 4 pins is drawn for inspection.
The probability for the first drawn pin to be defective
= 150/10,000 = 0.015
The probability for the second, third and fourth pins to be defective lies between 150/9,999 and 149/9,999,150/9998, and 148/9998, and 150/9,997 and 147/9,997, respectively. All these probability values, i.e., 150/10,000, 150/9,999, 149/9,999, 150/9,998, 148/9,998, 150/9,997 and 147/9,997 do not seem to differ much from each other and they can be safely assumed to be constant over the sample drawn. In other words, the probability of drawing a defective piston pin from a large lot, is constant for all components of the small sample drawn.
Let p be the probability of a component being defective,
and q be the probability of a component being non-defective.
Taking the above example.
P = 150/10,000 = 0.015 and q = (1-0.015) = 0.985
(Since p1 + p2 or, here p + q = 1).
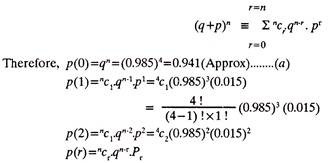
For such cases where the probability of success, P, (example: drawing a defective component) and that of failure, q, (example: drawing a non-defective component from the lot) remain constant for all the components in the sample drawn in n trials (one piece is drawn in a trial, without replacing the previously drawn piece), the probability of achieving r successes is given by the term p(r) of the Binomial Expansion of (q+p)r
From Eqn. (a) above it can be inferred that, the probability of drawing a non-defective piston pin is 0.941. In other words, if a random sample of four pins is drawn from the batch of 10,000 piston pins, a non-defective pin will be found 9,410 times.
Technique # 2. The Poisson Distribution:
The Poisson distribution appears frequently in the literature of management science and finds a large number of managerial applications. It is used to describe a number of managerial situations including the arrivals of patients at a health clinic, the distribution of telephone calls going through a central switching system, the arriving of vehicles at a toll booth, the number of accidents at a crossing, and the number of looms in a textile mill waiting for service.
All these examples have a common characteristic. They can all be described by a discrete random variable that takes on non-negative integer (whole number) values 0, 1, 2, 3, 4, 5 and so on; the number of patients who arrive at a health clinic in a given interval of time will be 0, 1, 2, 3, 4, 5 and so on.
Characteristics:
Suppose we use the number of patients arriving at a health clinic during the busiest part of the day as an illustration of Poisson Probability Distribution Characteristics:
(1) The average arrival of patients per 15-minute interval can be estimated from past office data.
(2) If we divide the 15-minute interval into smaller intervals of, say, 1 second each, we will see that these statements are true:
(a) The probability that exactly one patient will arrive per second is a very small number and is constant for every 1-second interval.
(b) The probability that two or more patients will arrive within a 1-second interval is so small that we can safely assign it a 0 probability.
(c) The number of patients who arrive in a 1-second interval is independent of where that 1- second interval is within the larger 15-minute interval.
(d) The number of patients who arrive in any 1-second interval is not dependent on the number of arrivals in any other 1-second interval.
It is acceptable to generalize from these conditions and to apply them to other processes of interest to management. If these processes meet the same conditions, then it is possible to use a Poisson probability distribution to describe them.
Calculating probabilities using Poisson distribution:
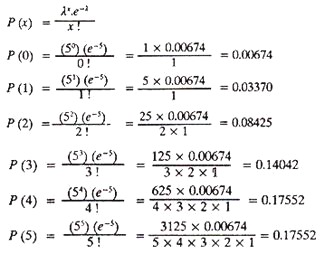
The probability of exactly x occurrences in a Poisson distribution is calculated using the relation
Example 2:
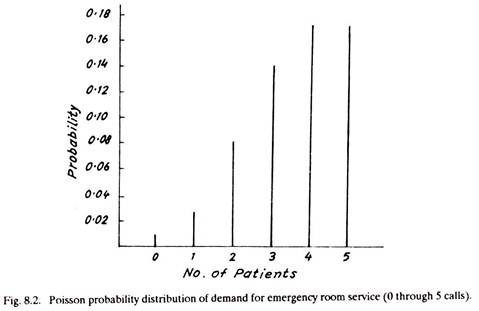
Consider a small rural hospital where the past records indicate an average of 5 patients arrive daily. The demand for emergency room service at this hospital is distributed according to a Poisson distribution. The hospital in charge wants to calculate the probability of exactly 0, 1, 2, 3, 4 and 5 arrivals.
Solution:
Probability values for any number of calls (i.e., beyond 5 in this example) can be found by making additional calculations.
Technique # 3. Normal Distribution:
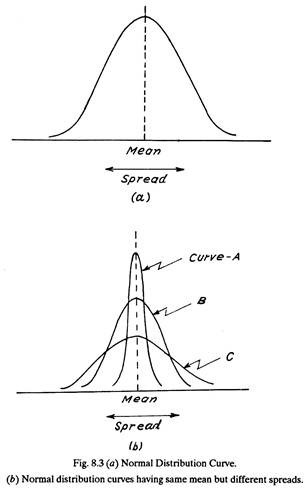
An important continuous probability distribution is the normal distribution or the Gaussian distribution. The most important distribution in statistics is the Normal Distribution. This distribution has a symmetric bell-shaped form and tends to infinity in both directions.
The normal distribution occupies an important place in management science for two reasons:
(1) It has properties that make it applicable to a number of managerial situations in which decision makers have to make inferences by drawing samples.
(2) The normal distribution comes quite close to fitting the actual observed distribution of many phenomena, including output from physical processes and human characteristics (e.g. height, weight, intelligence) as well as many other measures of interest to management in the social and natural sciences.
Characteristics:
Fig. 8.3 shows a normal distribution. The diagram indicates its several important characteristics:
(1) The curve has a single peak.
(2) It is bell shaped.
(3) The mean (average) lies at the center of the distribution and; the distribution is symmetrical around a vertical line erected at the mean.
(4) The two tails of the normal distribution extend indefinitely and never touch the horizontal axis.
Any normal distribution is defined by two measures:
(i) The mean (x) which locates the center, and
(ii) The standard deviation (a) which measures the spread around the center.
In Normal Distribution:
Distribution Pattern of Statistical Quality Control:
Statistical quality control relies upon theory and concept of probability, and probability basically accepts the possibility of variation in all things.
Generally, the variations occurring in (industrial processes or) products manufactured by an industry are classified as:
(a) Variations due to assignable causes, and
(b) Random or chance variations.
The variations (say in length or diameter of a component) which occur due to assignable causes possess greater magnitude as compared to those due to chance causes and can be easily traced. Various assignable causes leading to variations may be, differences amongst the skills of the operators, poor raw material and machine conditions, changing working conditions, mistake on the part of a worker (as in getting peculiar colour shade if he mixes different colours in wrong proportions), etc.
The chance variations occur in a random way and they can hardly be helped out as there is no control over them. For example, a random fluctuation in voltage at the time of enlargement (in photography) may produce a poor quality print. Chance variation is also due to some characteristics of the process or of a machine which function at random; for example a little play between nut and screw at random may lead to back-lash and (hence operate the cutting tool accordingly) thus result in a different final machined diameter of every job. The non-homogeneity (say difference in hardness along the length) of a long bar may result in difference in surface quality or finish.
The chance factors effect each component in a separate manner. Chance factors may cancel effect of each other also. When accurately measured, the dimensions of most of the components will concentrate close to the middle of the two extremes. This is called Central Tendency. In other words the maximum number of components will have sizes equal to or approximately close to the middle size and the sizes bigger or smaller than the middle size will be least frequent and lie near the two extremes.
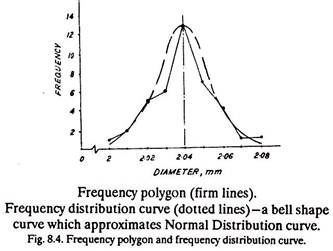
When the measured sizes of all the products are plotted against the frequency of occurrence of each size, in the form of a graph and the curve is smoothened, it resembles bell shape (See Fig. 8.4) and approximates Normal Distribution curve. The example 8.3 given below, explains central tendency and frequency distribution curve.
Example 3:
40 spindles were manufactured on a machine and their diameters in mm as measured are given below:
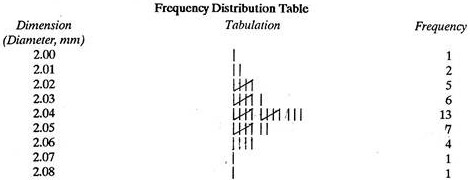
This data can be tabulated as follows:
The approximate normal distribution curve (of Fig. 8.4) shows the simplest ‘pattern of distribution’. Depending upon the type of thing being measured there is generally a Pattern of Distribution that indicates the way in which a dimension can vary. Figure 8.4 shows an approximate normal curve divided in half and half about the mean size, i.e. (2+2.08)/2=2.04 mm, thereby indicating that there are approximately equal number of items smaller and larger than the mean size on either side of the normal dimension.
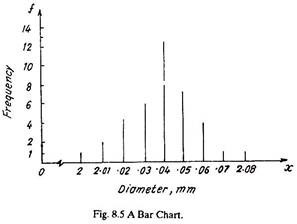
Figure 8.5 shows a Bar Chart plotted from the data given in the frequency distribution table. A bar chart makes use of and places bars at different values of measured dimensions. The height of each bar is proportional to the frequency of particular measured dimension (e.g., diameter).
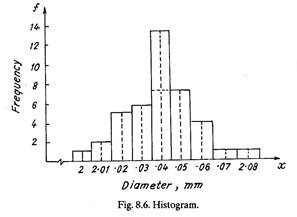
Figure 8.6 shows a Histogram which is another way of presenting frequency distribution graphically. Histogram makes use of constant width bars; the left and right sides of the bar represent the lower and upper boundary of the measured dimension respectively. The height of each bar is proportional to the frequency within that boundary; for example, it can be seen from Fig. 8.6 that the frequency between 2.035 and 2.045 mm diameters is 13.
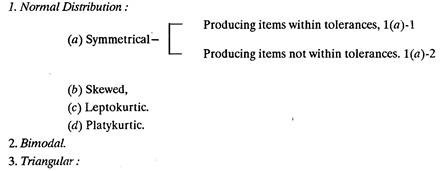
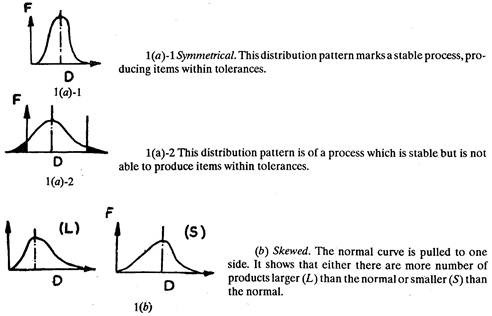
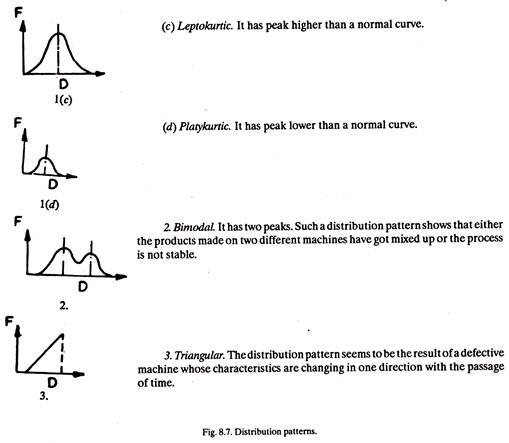
Various patterns of distribution are shown in Fig. 8.7.
Such patterns generate under different circumstances as explained under:
Technique # 4. Confidence Limits:
The confidence or control limits are calculated with the help of a statistical measure known as standard deviation, a, which is given by
where, X̅ is the mean value of the x values for the sample pieces, (x- x̅) is the deviation of an individual value of x, and n is the number of observations.
σ can be calculated easily by another relation also, given as under
and k is any number, preferably the central value of x series where x represents the observed reading or measured values of say, diameters of the spindles, ohmic resistance values of resistors, etc.
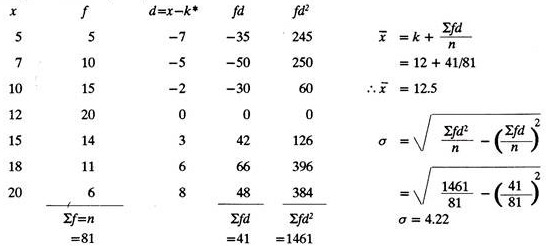
The following example will explain how to calculate standard deviation:
Example 4:
Find x̅ (mean) and σ.
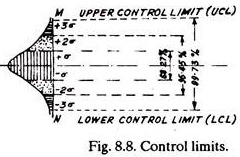
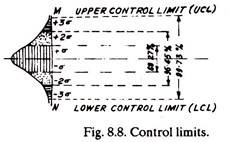
After calculating the value of standard deviation, σ, the upper and lower control limits can be decided. As shown in Fig. 8.8, 1σ limits occupy 68.27% of the area of the normal curve and indicate that one is 68.27% confident that a random observation will fall in this area. Similarly 2σ and 3σ limits occupy 95.45% and 99.73% area of the normal curve and possess a confidence level of 95.45% and 99.73%.
For plotting control charts (in statistical quality control) generally 3σ limits are selected and they are termed as control limits. They present a band (MN) within which the average dimensions of (sample) components are expected to fall. 2σ limits are sometimes called warning control limits.
Technique # 5. Measures of Central Tendency:
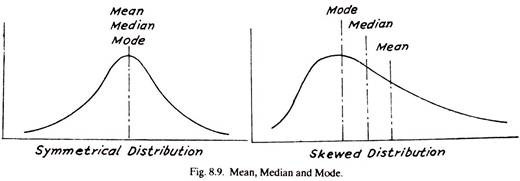
Most frequency distributions exhibit a Central tendency i.e., a shape such that the bulk of the observations pile up in the area between the two extremes, (Fig. 8.9). The measure of this central tendency is one of the two most fundamental measures in all statistical analysis.
There are three principal measures of central tendency.
(i) Mean (X̅):
The mean is calculated by adding the observations and dividing by the number of observations.
For example: Patients treated on 8 days.
Arithmetic mean is used for symmetrical or near symmetrical distributions or for distributions which lack a clear dominant single peak. The arithmetic mean, X, is the most generally used measure in quality work.
It is employed SO often to report average size, average yield, average percent of defective etc., that control charts have been devised to analyze and keep track of it. Such control charts can give the earliest obtainable warning of significant changes in the Central value.
(iii) Median:
It is the middle-most or most central value when the figures (data) are arranged according to size. Half of the items lie above this point and half lie below it. It is used for reducing the effects of extreme values, or for data which can be ranked but are not economically measurable (shades of colours, odors etc.) or for special testing situations.
If, for example, the average of five parts tested is used to decide whether a life test requirement has been met, then the lifetime of the third part to fail can sometimes serve to predict the average of all five and thereby the decision of the test can be made much sooner. To find the median of a data set, just array the data in ascending or descending order. If the data set contains an odd number of items, the middle item of the array is the median. If there is an even number of items, the median is the average of the two middle items. In formal language, the
Example 5:
Data set containing even number of items.
Patient treated in emergency ward on 8 consecutive days.
Therefore, 39 is the median number of patients treated in the emergency ward per day during the 8-day period.
(iii) Mode:
It is the value which occurs most often in data set. It is used for severely skewed distributions, describing an irregular situations where two peaks are found, or for eliminating the effects of extreme values. To explain mode, refer to data given below which shows the number of delivery trips per day made by a Redi-mix concrete plant.
The modal value of 15 implies that the plant activity is higher than 6.7 (which is mean). The mode tells us that 15 is the most frequent number of trips, but it fails to let us know that most of the values are under 10.
Technique # 6. Estimation:
Statistical quality control tells what should be the sample size and how much reliable will be that sample. In other words, a criteria can be decided on the basis of which a lot will be accepted or rejected.
A common thing in statistics is the Estimation of parameters on the basis of a sample. A sample mean is generally not enough as its value may not be same as the mean size of the total lot, out of which the sample is drawn. Thus it is better to indicate the reliability of the estimates and provide limits which may be expected to contain the true value. An example will clarify the point. Let a batch of spindles contain 100 pieces.
Diameter of each spindle is measured and the mean batch diameter is found as 3.48 mm. Next, a sample of five spindles is picked from random places in the lot, their diameters are measured and mean sample diameter is calculated. In rare cases it may be the same as mean batch diameter, (i.e., 3.48 mm) otherwise not.
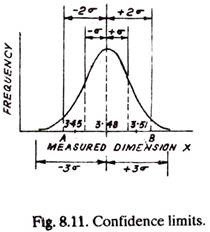
Considering this, it seems appropriate to attach limits to mean batch diameter, (like 3.48 ± 0.03 mm), that is 3.51 mm and 3.45 mm will be the two sizes in between which if the size of a spindle lies, the spindle will be accepted otherwise rejected. These two sizes represent confidence limits which can be found by knowing the area under the normal curve which the two sizes (3.51 mm and 3.45 mm) occupy.
Assume that the two values of X are such that they lie at A and B (See Fig. 8.11). It shows 95.45% confidence level which means that there is only 4.55% chances that the random observation (measured dimension of the spindle) will not represent the facts or it will not fall between the selected batch mean diameter limits. The greater the value of σ the wider will be the distance AB for the same confidence level.
The following relationship determines sample size for a particular level of confidence:
where
S = The desired accuracy of results (say ± 5%),
p = % of occurrence (expressed as decimal),
N = sample size,
C = 1 for a confidence level of 68.27%,
1.96 for a confidence level of 95%,
2 for a confidence level of 95.45%,
and 3 for a confidence level of 99.73%.
Technique # 7. Significance Testing:
Significance tests are employed to make decisions on the basis of small information available from the samples. With all such decisions an amount of risk is involved. Consider a lot or batch of piston pins to be inspected for their diameters. A sample of say 5 piston pins is drawn at random from the lot, diameters are measured and sample mean is averaged out. Another sample of 8 piston pins is drawn and again sample mean is calculated. Lastly the whole lot is inspected as regards its diameter and mean lot diameter is found out.
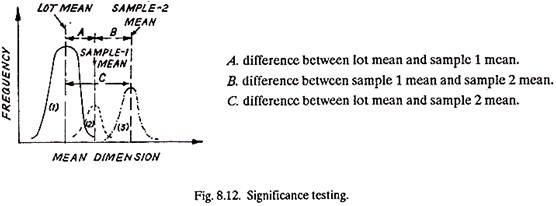
It will be observed that, not necessarily the mean of sample 1, sample 2 and the lot will have the same value. The chances for such a coincidence are very little. So the question arises how big the difference between the mean of one sample and the other, or of one sample and the lot must be so that it can be called Significant.
Figure 8.12 shows the difference between the means of two samples (mentioned above) and the lot. It appears as if distributions (1) and (2) belong to the same population whereas (1) and (3) are significant distance apart.
The lot mean has its own standard deviation and the two sample means have their own values of standard deviation.
The following relation connects the values of standard deviation of the sample and the lot:
It is not difficult to find the probability that a sample mean will be Kσ (K times the standard deviation) away from the lot mean, where K is a number.
Procedure:
In significance testing first of all a hypothesis is set which is then tested. The hypothesis can be-the mean tensile strengths of the pieces taken from existing and modified ferrous alloys are not different. This hypothesis will next be rejected or accepted. The samples from the two ferrous alloys will be tested as regards their tensile strengths and statistics will be computed from the measured strength values.
The criteria for the rejection of hypothesis depends upon the difference (distance) between the lot mean and the sample mean or sample to sample mean. Depending upon the actual problem, the rejection may be made if this distance exceeds the significant value or it is less than the significant value.
For example, an existing ferrous alloy contains alloying elements A, B and C and a number of pieces of this alloy (samples) when tested give a tensile strength of X tonnes/cm2. The alloy is modified by the further addition of an element D and when again a number of pieces of the modified alloy are tested, a mean strength of Y tonnes/cm2 is observed.
Now, the modified alloy will be accepted only if it can take fairly high tensile load as compared to the previous alloy. In other words, the two samples means (See Fig. 8.12) must be significant distance apart in order to prove that the modified alloy is better.
Take another example; from the same lot two or more samples are selected, their dimensions are measured and sample means calculated. Naturally the lot will be accepted only when the means of samples are close to one another and the distance between them does not increase beyond the sign cant value.
The value of the significant (distance) difference depends upon:
(a) Standard Deviation or the variability of the size or dimension (say diameter in case of piston pins). The greater the standard deviation, for a difference (between the means) to be significant, it (difference) should be more.
(b) Sample size (number of pieces in one sample). The larger the sample, for a difference to be significant, it (difference) should be smaller.
(c) Level of significance. It indicates the level (0.1%, 5%) at which the difference is significant.
Three variations under significance testing can be considered:
(a) Testing two random samples as regards their sample means.
(b) Testing a sample mean against a lot mean.
(c) Testing sample means of two samples, one being manufactured by the existing process and the other by the modified process.
Four different cases can be analysed:
(a) Testing the difference between sample mean and lot mean employing bigger sample size (say containing more than 25 pieces).
(b) Testing the difference between sample mean and lot, population, or true mean, employing small sample size (say containing less than 25 pieces).
(c) Testing the difference between sample mean and the mean of another sample from another lot employing large sample size.
(d) Testing the difference between sample mean and the mean of another sample from another lot employing small sample size.
The case (a) above has been discussed in the following example:
Example 6:
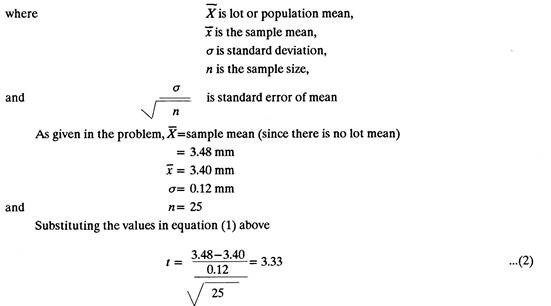
An accurate saw was supposed to cut pieces from a bright M.S. bar in normal lengths of 3.4 mm. After some time it was found that instead the nominal value, it was cutting pieces of 3.48 mm length. Twenty-five pieces were tested for significance. They had a mean of 3.48 mm and a standard deviation of 0.12 mm. Test the significance and decide whether the hypothesis that the pieces cut afterwards were oversized is true or not.
Solution:
A sample containing 25 pieces or more can be regarded as a large sample and thus the relation for finding the significance level t is as follows:
It can be proved that:
(a) t = 1.96 indicates just significant level,
(b) t = 3.09 indicates very significant level, and
(c) t = 3.5 indicates very significant level.
Coming to the problem, the value of t as calculated above in equation (2) is 3.33 which indicates a very significant level and hence the hypothesis that the pieces cut afterwards were oversized is true.
Technique # 8. Analysis of Variance:
Variance is the square of standard deviation,
Analysis of variance is a very powerful technique in the discipline of Experimental statistics. It solves those problems where, even t-test (described in significance testing) is unable to make clear which, of the many significant differences, really indicate the true differences. Moreover, analysis of variance can be very much used for analysing the results of enquiries conducted in the field of industrial engineering, agriculture, etc.
There can be:
(a) Variance between varieties or variance between treatments (i.e., alloy making), and
(b) Variance within varieties or variance within treatments.
In other words there is variance between different treatments and variance between the samples having the same treatment.
The variance within the treatments is smaller than the variance between the treatments and always there is some cause if a good amount of difference between the variances is seen.
The following example will clarify the procedure of analysis of variance and for testing the significance of differences:
Example 7:
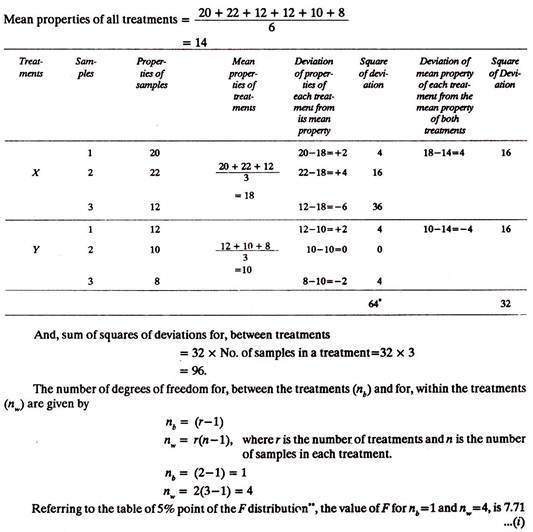
Two different treatments X and Y were given to an alloy. When three pieces with each treatment were tested they gave the following properties (values) Formulate a table of analysis of variance and find out the significance of difference between the properties of two treatments.
Solution:
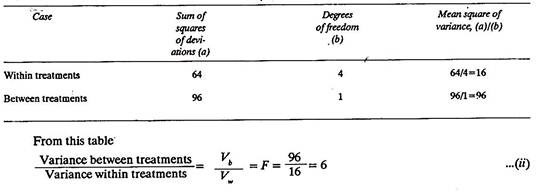
First of all the variance between and the variance within the treatments is calculated. The following table is formed.
Comparing (i) and (ii) above; the 5% value of F for nb and nw degrees of freedom is 7.71 which is more than the calculated value 6, i.e., (ii) Hence the difference of properties in the treatments is not significant.
Technique # 9. Control Charts:
Control Charts are based on statistical sampling theory, according to which an adequate sized sample drawn, at random, from a lot represents the lot.
All processes whether semi-automatic or automatic are susceptible to variations which in turn result in changes in the dimensions of the products. These variations, occur due to either chance causes or due to certain factors to which we can assign the causes for such variations. Variation in the diameter of spindles being manufactured on lathe may be either due to tool wear, non- homogeneity of bar stock, changes in machine settings, etc.
The purpose of control chart is to detect these changes in dimensions and indicate if the component parts being manufactured are within the specified tolerance or not.
Definition and Concept:
Control chart is a (day-to-day) graphical presentation of the collected information. The information pertains to the measured or otherwise judged quality characteristics of the items or the samples. A control chart detects variations in the processing and warns if there is any departure from the specified tolerance limits.
A control chart primarily is a diagnostic technique. It is dynamic in nature, i.e., it is kept current and up-to-date as per the changes in processing conditions. It depicts whether there is any change in the characteristics of items since the start of the production run. Successively revised and plotted control chart immediately tells the undesired variations and it helps a lot in exploring the cause and eliminating manufacturing troubles.
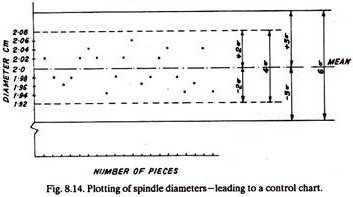
Assume a turret was set to produce 1000 spindles of 2 cm diameter. After they were made, their diameters were measured and plotted as below (See Fig. 8.14).
Certain measured diameter values lie quite close to the desired dimension (i.e., 2.0 cm), which is also known as mean diameter or mean value, whereas other diameter values are quite far from the mean value.
Because of the fact that variations are inherent in all processes and therefore in product dimensions (and which is also evident from Fig. 8.14 as very few spindles have exactly 2.0 cm diameter), it becomes necessary to accept all those pieces which fall under a set of specified tolerance limits or control limits; otherwise, sticking to single mean value will result in huge scrap percentage. As soon as the control limits are incorporated in Fig. 8.14 – as upper and lower tolerance limits, Fig. 8.14 forms a control chart.
These limits can be 1σ, 2 σ, or 3 σ, depending upon whether the confidence level is 68.27%, 95.45%, or 99.73%. Normally 3 σ limits are taken for plotting control charts, and (3σ +3σ) i.e., 6a spread is known as the basic spread. Besides 3 σ control limits certain control charts also show warning limits spaced at 4σ spread. Warning limits inform the manufacturer—when the items or samples are approaching the danger level so that he can take an action before the process goes out of control.
Control Charts—Purpose and Advantages:
1. A Control Chart indicates whether the process is in control or out of control.
2. It determines process variability and detects unusual variations taking place in a process.
3. It ensures product quality level.
4. It warns in time, and if the process is rectified at that time, scrap or percentage rejection can be reduced.
5. It provides information about the selection of process and setting of tolerance limits.
6. Control charts build up the reputation of the organization through customer’s satisfaction.
Types of Control Charts:
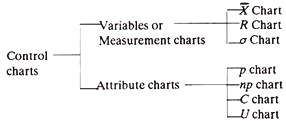
Like sampling plans, control charts are also based on Attributes or Variables. In other words, quality can be controlled either through actual measurements (of dimensions, weight, strength, etc.) or through attributes (as yes or no criteria), for example by using go and no go gauge and without caring for the actual dimensions of a part. The concept of attributes and variables has been discussed under sampling inspection.
A comparison of variables and attribute charts is given below:
1. Variables charts involve the measurement of the job dimensions and an item is accepted or rejected if its dimensions are within or beyond the fixed tolerance limits; whereas an attribute chart only differentiates between a defective item and a non-defective item without going into the measurement of its dimensions.
2. Variables charts are more detailed and contain more information as compared to attribute charts.
3. Attribute charts, being based upon go and no go data (which is less effective as compared to measured values) require comparatively bigger sample size.
4. Variables charts are relatively expensive because of the greater cost of collecting measured data.
5. Attributes charts are the only way to control quality in those cases where measurement of quality characteristics is either not possible or it is very complicated and costly to do so -as in the case of checking colour or finish of a product, or determining whether a casting contains cracks or not. In such cases the answer is either Yes or No.
Commonly used charts, like X̅ and R charts for process control, P chart for analysing fraction defectives and C chart for controlling number of defects per piece, will be discussed below:
(a) X̅ Chart:
1. It shows changes in process average and is affected by changes in process variability.
2. It is a chart for the measure of central tendency.
3. It shows erratic or cyclic shifts in the process.
4. It detects steady progress changes, like tool wear.
5. It is the most commonly used variables chart.
6. When used along with R chart:
(i) It tells when to leave the process alone and when to chase and go for the causes leading to variation;
(ii) It secures information in establishing or modifying processes, specifications or inspection procedures; and
(iii) It controls the quality of incoming material.
7. X̅ and R charts when used together form a powerful instrument for diagnosing quality problems.
(b) R-Chart:
1. It controls general variability of the process and is affected by changes in process variability.
2. It is a chart for measure of spread.
3. It is generally used along with an x-chart.
Plotting of X̅ and R Charts:
A good number of samples of items coming out of the machine are collected at random at different intervals of times and their quality characteristics (say diameter or length etc.) are measured.
For each sample, the mean value and range is found out. For example, if a sample contains 5 items, whose diameters are d1 d2 d3 and d4, the sample average,
X̅ = d1 + d2+ d3+ d4 + d5/5 and range,
R = maximum diameter-minimum diameter.
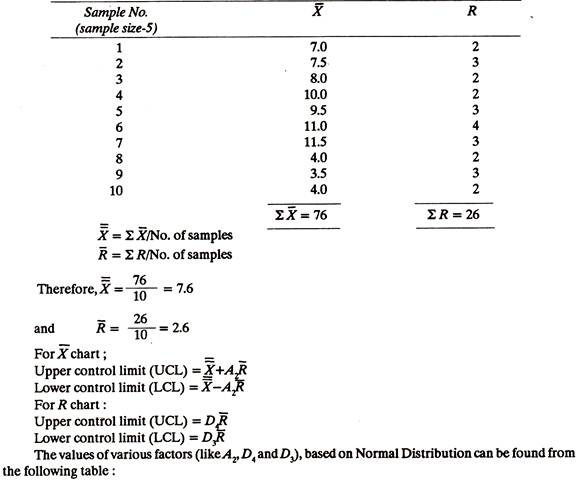
A number of samples are selected and their average values and range are tabulated. The following example will explain the procedure to plot X̅ and R charts.
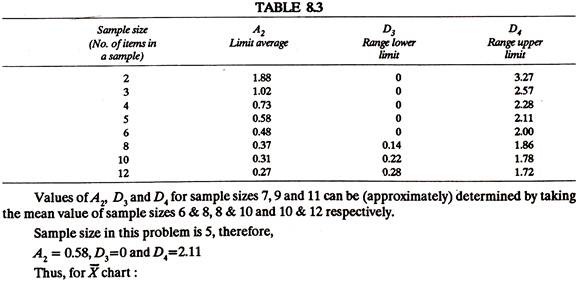
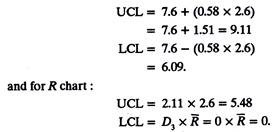
Example 8.
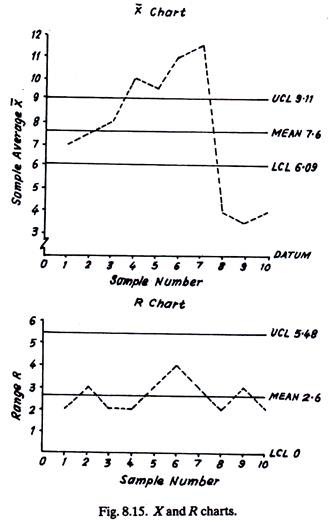
These control limits are marked on the graph paper on either side of the mean value (line). X̅ and R values are plotted on the graph and joined (Fig. 8.15), thus resulting the control chart.
From the X̅ chart, it appears that the process became completely out of control from 4th sample onwards.
(c) p-Chart:
1. It can be a fraction defective chart or % defective chart (100 p).
2. Each item is classified as good (non-defective) or bad (defective).
3. This chart is used to control the general quality of the component parts and it checks if the fluctuations in product quality (level) are due to chance cause alone.
4. It can be used even if sample size is variable (i.e., different for all samples), but calculating control limits for each sample is rather Cumbersome.
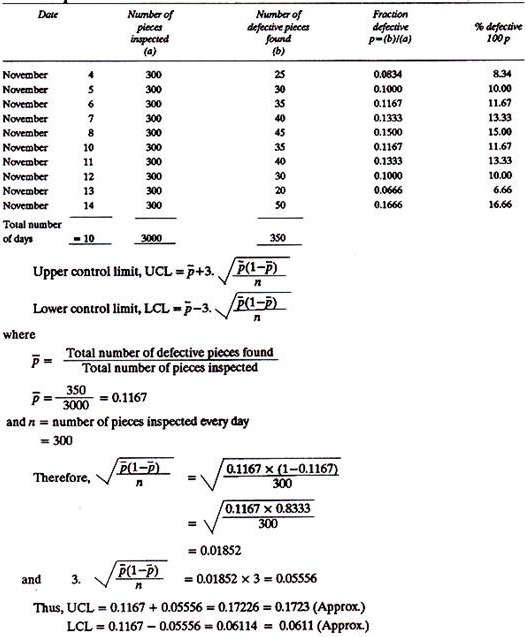
P-chart is plotted by calculating, first, the fraction defective and then the control limits. The process is said to be in control if fraction defective values fall within the control limits. In case the process is out of control an investigation to hunt for the cause becomes necessary.
The following example will explain the procedure of calculating and plotting a p-chart:
Example 9:
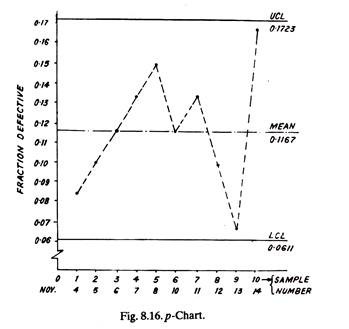
Mean, UCL and LCL are drawn on the graph paper, fraction defective values are marked and joined. It can be visualized (from Fig. 8.16) that all the points lie within the control limits and hence the process is completely under control.
(d) C-Chart:
1. It is the control chart in which numbers of defects in a piece or a sample are plotted.
2. It controls number of defects observed per unit or per sample.
3. Sample size is constant.
4. The chart is used where average numbers of defects are much less than the number of defects which would occur otherwise if everything possible goes wrong.
5. Whereas, p-chart considers the number of defective pieces in a given sample, C-chart takes into account the number of defects in each defective piece or in a given sample. A defective piece may contain more than one defect, for example a cast part may have below holes and surface cracks at the same line.
6. The C-chart is preferred for large and complex parts. Such parts being few and limited, however, restrict the field of use for C-chart (as compared to p-chart).
C-chart is plotted in the same manner as p-chart except that the control limits are based on Poisson distribution which describes more appropriately the distribution of defects.
The following example will explain the procedure for plotting C-chart:
Example 10.:
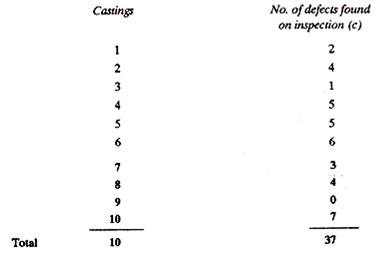
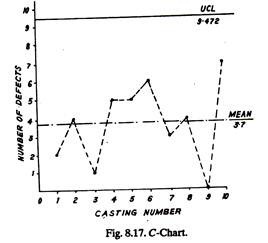
Ten castings were inspected in order to locate defects in them. Every casting was found to contain certain number of defects as given below. It is required to plot a C-chart and draw the conclusions.
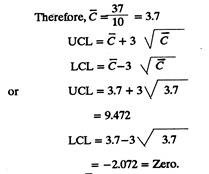
Value of C, control limits and number of defects per casting are plotted on the graph paper, Fig. 8.17. It is concluded that since all the values of C lie within the control limits, the process is under control. (Lower control limit is negative and thus has been taken as being zero).
Applications of Control Chart Control charts find applications in controlling the quality characteristics of the following:
1. Final assemblies (Attribute charts).
2. Manufactured components (shafts, spindles, balls, pins, holes, slots, etc.), (Variables charts).
3. Bullets and shells (Attribute charts).
4. Soldered joints (Attribute charts).
5. Castings and cloth lengths (Attribute, C-charts).
6. Defects in components made of glass (C-charts).
7. For studying tool wear (Variables charts).
8. Punch press works, forming, spot welding, etc., (Attribute charts).
9. Incoming material (Attribute or Variables charts).
10. Large and complex products like bomber engines, turbines, etc., (C-charts).
Technique # 10. Life Testing:
The life of a part is one of its quality criteria. For example, life of a spark plug or of a radio tube or of the crankshaft of an I.C. Engine, gives an idea of its quality. A good quality product is considered to have longer life.
The life of a component may be defined as the time period during which the part retains its quality characteristics. For example, the cylinder block of an I.C., Engine may not burst but if it wears out or develops ovality or taper, it is assumed that the life of the cylinder block is over. No matter afterwards the cylinder may be rebored and it may work with the next size piston for another life cycle.
Life tests are carried out in order to access the working life of a product, its capabilities and hence to form an idea of its quality level.
Life Tests:
Life tests are carried out in different manners under various conditions:
(a) Tests under Actual Working Conditions:
To subject a component to its actual working conditions for full duration for life test (e.g., testing an engine of an aircraft for 30,000 to 60,000 hours), if not impossible, is quite laborious, cumbersome, time consuming and just impracticable. Moreover such full duration tests do not lend any help in controlling a manufacturing process.
(b) Tests under Intensive Conditions:
Consider an electric toaster, which works for say 1 hour every day. If it were to be life tested under actual working conditions, it would be energized for only one hour per day and it will be noticed that after how many days the heating element fails. But, while testing under intensive conditions the idle times between two energizing operations of the toaster are eliminated.
It is worked continuously at rated specifications (i.e., voltage, etc.) and thus the life can be estimated in a much shorter duration of time. However, the toaster may be de-energized for some period during intensive testing in order to study the effect of alternate heating and cooling on the material of heating element.
(c) Tests under Accelerated Conditions:
These tests are conducted under severe operating conditions to quicken the product failure or break-down. For example, an electric circuit may be exposed to high voltages or high currents, a lathe may be subjected to severe vibrations and chatter, a refrigerator performance may be checked under high ambient temperature conditions, etc., etc.
Statistical technique can be used to plan and analyse the data of life (destructive) tests by sampling techniques and control charts. Sometimes, all the sample pieces need not be destructively tested, rather the results can be concluded from the time of first and middle failure.
However, only through destructive testing the potential capability of a product can be determined. Sometimes management may not like to destroy their good products, but destructive testing is essential to reveal to the designer the weakest component of the chain. In development testing, a designer should get the component fabricated exactly under those conditions and specifications with which it will be manufactured, once tested okay. He should incorporate even the minute design changes in the sample fabricated for testing.
Dr. Davidson developed a table which shows, for a life test, the relationship between the sample size, probability and percent of units which will fail before their shortest life. According to that table if one wants to be 75% sure (probability) that not more than 10% of the components would fail before their shortest life of Z-hours, he should conduct life tests on only 28 components.
Dr. Weibull evolved Probe Testing and with this-it is possible to plan tests and get maximum information as can be had from pure statistical techniques, but by conducting comparatively lesser number of tests.
Technique # 11. Reliability and Reliability Prediction:
The study of reliability is important because it is related to the quality of a product. Generally, components having low reliability are of poor quality but extra high quality does not always make a product of higher reliability. A poorly designed component even having very good material, surface finish and tolerances may have low reliability.
The reliability of a product is the Mathematical Probability that the product will perform its mission successfully and function for the required duration of time satisfactorily under pre-decided operating conditions.
In manufacturing almost all products and especially those, involving human lives like aircrafts, submarines, nuclear plants, it is highly essential to know and to be sure about the reliability of the individual parts and of the whole structure as a single entity.
The reliability prediction involves a quantitative evaluation of the existing and proposed product designs. It leads to a much better end product.
Reliability for a given time T and M (the mean time between failures, MTBF) is given by
RT=e–™ for an individual part ……….. (1)
and for the system
R(S)T = Ra(T) x Rb(T) x Rc(T) x …………..Rz(T) ………. (2)
where Ra, Rb….. are the reliabilities of part A, part B, etc.
Steps in Reliability Calculation:
Step-1:
Find from the previous use of the product the number of parts and part failure rates.
Step-2:
Design overall reliability of the product considering stress levels and information of step-1.
Step-3:
Finally design and evaluate overall reliability using information of first two steps and environmental conditions, cycling effects, special maintenance, system complexity, etc.
Step-4:
Obtain the test results of the system. Calculate MTBF as explained in the following example.
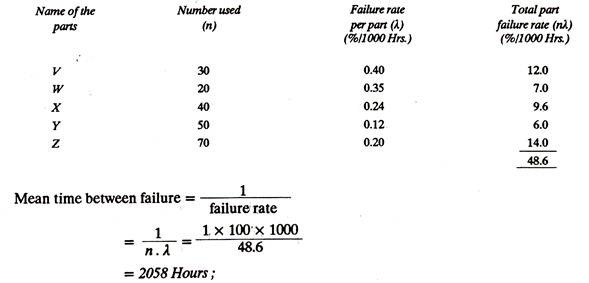
Example 11:
To test the design of a typical circuitry of a weapon system.
Mean time between failure = 1600 Hrs.
against the requirements of only 1600 hours. Thus the (modified) design is perfectly reliable and hence acceptable.
Similar calculations can be made on the basis of the usage data supplied by the customers.
Reliability Increasing Techniques:
Product reliability can be increased by using following techniques:
(a) Through simplification of the design, that is, by decreasing the number of component parts for a system and believing in Vital Few. It is clear from equation (2) that the reliability of a system is obtained by multiplying the reliabilities of the various parts.
If a product has 5 parts, each with reliability 0.9 then the total probability is 0.9 x 0.9 x 0.9 x 0.9 x 0.9 = 0.59 whereas, if there would have been only three parts the probability of the system would be 0.9 x 0.9 x 0.9 = 0.73.
(b) By having Redundancy Built into the System:
Redundant components are provided in the system to take over, as soon as the actual component stops functioning. Example: Using a four engine aircraft which otherwise flies on three engines; the fourth engine being redundant.
(c) Principle of Differential Screening:
From a batch, screen, select and separate those components which exhibit high reliability, medium reliability and low reliability and use these components in products requiring only that much reliability. For example, highly reliable components may be used in military signalling devices and those of medium reliability in commercial applications.
(d) Principle of Truncation of Distribution Tails:
Referring to Fig. 8.8 the components which fall under 1σ limits are not likely to fail easily as those under 3σ limits.
(e) Reliability:
Reliability can be increased by avoiding those component parts which cannot stand maximum strength and stress requirements in their intended applications.
(f) Principle of Burn in Screening:
It involves short term environmental tests which are conducted under severe stress conditions for eliminating parts having low reliability.
Technique # 12. Monte-Carlo Simulation:
Monte-Carlo method is a simulation technique which is generally employed when the mathematical formulae become complex or the problem is such that it cannot be shaped reliably into mathematical form. Monte-Carlo method is not a sophisticated technique, rather it has empirical approach and bases itself on the rules of probability. Monte-Carlo method tries to simulate the real situation with reasonably predictable variations. The method makes use of cardboard tabs, random tables, etc.
The tabs bear some relevant numbers on them, one tab at a time is drawn, its number is noted and then it is replaced before once again a tab is drawn from the bag or box (containing the tabs). This procedure is repeated until the desired solution for the problem is reached. The method can analyse business and other problems in which events occur with assigned probabilities.
The Monte-Carlo method may find applications as follows:
(a) To simulate the functioning of the complaint counter,
(b) Queuing problem,
(c) To estimate optimum spare parts for storage purposes,
(d) To find the best sequence for scheduling job batch orders,
(e) To estimate equipment and other machinery to take care of peak loads, and
(f) Replacement problems.
The following example will explain the procedure to solve a typical (problem) application of Monte-Carlo method.
Example 12:
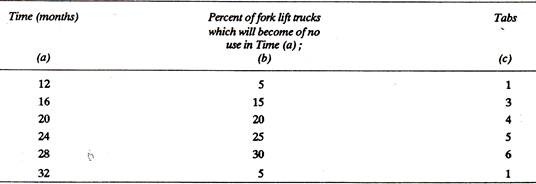
ABC company has 10 fork lift trucks at present. It is interested to know that how many more trucks it is likely to have to buy during the next five years (60 months) to maintain its fleet of 10 trucks.
From the past history the following information has been obtained which is expected to hold true for future also.
Solution:
Column (b) values are in multiples of 5. It is the ‘percent’ of fork lift trucks which will become of no use in certain specified months.
First of all 1/5% = 100/5 = 20 little thick paper tabs are prepared.
Column (c) has been prepared from column (b) after dividing each value of column (b) by 5.
Considering columns (c) and (a), 20 tabs are marked as follows:
1 Tab bears the number 12,
3 Tabs bear the number 16, 4-20, 5-24, 6-28 and 1 tab-32.
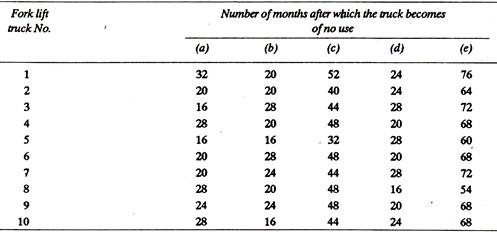
The next step is to make the following table:
All the 20 tabs are put in a bag and at random one tab is drawn and the number written on it (say it is 32) is marked against truck 1. The tab is put in the bag and at random again another tab is drawn and its number (say 20) is marked against truck 2 and so on it is repeated till the first column (a) gets completed. It is inferred from column (a) that truck No. 1 will last for 32 months, truck 2 for 20 months and so on.
Each truck will be replaced after its life time, i.e., truck 1 after 32 months, truck 2 after 20 months and so on. By the same procedure as above the life of the new trucks (which have replaced old ones) will next be estimated. Draw the tabs at random one by one from the bag and put values against the trucks under column (b).
Add columns (a) and (b) and put these figures under column (c). It is found that even after this set of replacement of trucks, no truck is in a position to reach its, target of 60 months (i.e., 5 years). Therefore these trucks are again replaced; one by one tabs are drawn and the expected lives of next replacements are written under column (d). Columns (c) and (d) are then added and written as column (e) which shows that all the trucks will last 60 months, (i.e., 5 years) or beyond.
Therefore to keep 10 trucks going all the time for 60 months, 20 replacement trucks [10 of column (b) + 10 of column (d)] will be needed and thus the company is likely to have to buy 20more trucks during the next five years to maintain its fleet of 10 trucks.
Technique # 13. The Zero Defect Concept:
The Zero Defect concept is a formula for a management programme which seeks the voluntary participation of workpeople in undertaking personnel responsibility for the quality of the task in hand. It is an approach to the problem of securing a high level of error-free work performance.
Evolution:
The Zero Defect concept originated in 1961 by Philip Crosby, then quality manager for the Martin Company of Orlando, Florida, and later developed into a phased strategy by Jim Halpin, Martin’s quality director, the concept was first applied to a missile production programme for the U.S. Government.
Despite a marginally feasible delivery date (8-weeks only), Martin guaranteed to produce a defect-free missile on schedule, basing their confidence on a decision to make a complete departure from the normal procedures of inspection and test.
Where these stages would usually add to production time, Martin’s technique was to establish a’ running production-line inspection by operatives who were individually pledged to achieve the necessary quality standard at the first manufacturing or assembly operation.
In fact, the slogan used to motivate employees throughout the critical period was Do it right the first time.
Principle:
We as individuals have a duel standard; one for our work and one for ourselves.
We are conditioned to believe that error is inevitable; thus we not only accept error, we anticipate it. It does not bother us to make a few errors in our work, whether we are designing circuits, soldering joints, typing letters… but in our personal life we do not expect to bring less amount (every now and then) when we cash our pay-cheque; nor do we enter a wrong house periodically by mistake. We, as individuals, do not tolerate these things. Z.D. concept was founded on principles such as these, by Martin.
Implementing a Z.D. programme:
The steps described below contribute to the implementation of a Z.D. programme:
(a) Personal Challenge:
The employees should be challenged to attempt error-free performance. The employees are requested to voluntarily sign a pledge-card—a printed promise that he will strive to observe the highest standards of quality and performance.
A pledge-card may be like this:
… ‘I freely pledge myself to make a constant conscious effort to do my job right the first time, recognising that my individual contribution is a vital part…. etc.’
(b) Identification of Error-Cause:
The problems which obstruct the Z.D. aim should be identified, defect sources revealed and their causes rectified.
The purpose of this phase is to provide employees with a background of knowledge, and on the basis of this, to encourage them to remain alert to (and report) potential sources of defect. Obviously, the necessary channels of communication between employees and supervisor are opened.
(c) Inspection:
The inspection should be a continuous and self-initiated process.
The employee is given to understand clearly his personal responsibility for the quality of his own work. He is taught the specific quality points he is expected to monitor, and encouraged to report promptly any out-of-control conditions so that the necessary corrective action can be taken. Training for this role may include the use of a Z.D job break-down sheet. This is presented in two columns, one showing the logical sequence of operations, the other showing critical factors which determine whether the job is being carried out without defect.
Once again tremendous importance is attached to individual contributions to the Z.D. activity and Defect Cause Removal programmes are incorporated in the general pattern.
Defect Cause Removal is a system through which each individual can contribute to the total Z.D. programme. All employees are eligible to submit a Defect Cause Removal proposal/recommendation.
The Defect Cause Removal Proposal is submitted, in the first instance, by the originator to his immediate superior. It states the location and nature of the defect and whether it is actual or potential.
The originator is asked additionally, to describe the existing situation which causes or threatens to cause, the defect observed, or foreseen. This should be done simply, and with sufficient clarity to enable the supervisor to identify the method, device, part, operation, equipment and area involved without difficulty.
It he is able, and so wishes, the originator may state his recommendations for correcting or eliminating the cause of the defect. ‘Remember: you do not have to do this’. Identification of the defect cause is half the battle; someone else (whether the supervisor or any other person nominated by Z.D. Program Administrator) will endeavour to supply a satisfactory removal solution.
In every case, it is considered essential that the originator should receive an acknowledgement of his proposal and an assurance that he will be advised of the steps taken to deal with it.
(d) Motivation:
The management should provide continuous motivation by arousing and sustaining employees interest in the Z.D. programme, through the use of attention-getting techniques. Techniques and tools used in this phase are those of the Advertising industry- i.e., by leaflets, meetings, special employee bulletins, pledge cards, displays of reject work accompanied by notice of contract cancellations etc.
Other techniques/devices are Recognition certificates, plaques and Awards, etc. Equally significant can be the contribution made by the company training department, where the basic ZD. precepts may be directed at apprentices, new employees and operatives undergoing retraining in the use of new machines and equipment etc.
Technique # 14. Quality Circle (Q.C):
Quality circle is a small group of employees (8-10) working at one place, who come forward voluntarily and discuss their work related problems once in a week (say) for one hour. Workers meet as a group and utilise their inherent ability to think for themselves for identifying the constraints being faced by them and pooling their wisdom for final solutions that would improve their work life in general and contribute towards better results for the organisation.
Characteristics of Q.C:
(a) It is a philosophy as against technique:
(1) It harmonises the work.
(2) It removes barrier of mistrust.
(3) It makes workplace meaningful.
(4) It shows concern for the total person.
(b) It is voluntary.
(c) It is participative.
(d) It is group activity.
(e) It has management’s support.
(f) It involves task performance.
(g) It is not a forum to discuss demands or grievances.
(h) It is not a forum for management to unload all their problems.
(i) It is not a substitute for joint-plant councils or work committees.
(j) It is not a panacea for all ills.
Objectives of Q.C:
(1) To make use of brain power of employees also in addition to their hand and feet.
(2) To improve mutual trust between management and employees/unions.
(3) To promote (group) participative culture which is the essence of quality circle concept.
(4) To improve quality of the organisation.
Benefits from Q.C:
1. Improvement quality.
2. Increase in productivity.
3. Better house-keeping.
4. Cost reduction
5. Increased safety.
6. Working without tension.
7. Better communication.
8. Effective team work.
9. Better human-relations.
10. Greater sense of belongingness.
11. Better mutual trust.
12. Development of participative culture.
Starting a Quality Circle:
Step-1:
Explain to employees-what is quality circle and what possibly can be achieved by it.
Step-2:
Form a quality circle of;
(i) about 8-10 employees
(ii) working at the same area,
(iii) having the same wavelength and
(iv) who are interested to join the quality circle voluntarily.
Step-3. (a) First meeting:
(i) Choose team leader and deputy leader.
(ii) Doubts of employees, if any, will be removed in this meeting.
(b) Second meeting:
(i) List all problems.
(ii) Identify the problem to be taken first.
(iii) Conduct brain-storming session.
(iv) Leader keeps on recording the minutes.
(c) Third meeting and onwards:
(i) Problem analysis by members.
(ii) Study of cause and effect relations. For example, if two machines are looked after by one worker what good or bad will happen.
(iii) Solutions recommended.
