Get the answer of: What is Gantt Progress Chart ?
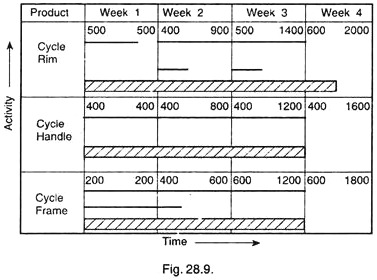
A Gantt progress chart gives the comparison between the actual and planned performance. It indicates how performance matches with the fixed targets. To explain things more clearly, following example of Gantt progress chart has been solved.
The figures indicated in the left-hand corner of each square shows the target for the week and the figures in the right of the corner gives the cumulative target for the week’s upto the end of that week. Thus the targets for the third week for cycle handle is 400 and for the three weeks 1200.
A “Thin line” drawn across the square shows the actual performance as compared with target for figures given in the top left corner. If the actual performance exceeds the target, a second line is drawn in the square as shown in the chart for Cycle Rim in second and third weeks. A ‘thick continuous line’ gives the proportion of cumulative target.
For the above example, the following information can be obtained from the chart:
Cycle Rim:
The target for the first week was 500 but produced 300. Therefore, the target for the second week lowered to 400 but 500 produced. During the third week target made to 500 but 700 produced. The actual performance was 1500 as against 1400 for the target set. A very creditable performance. The slow output during the ‘First week, may be due to new process or initial problems etc.
Cycle Handle:
The chart indicates that both targets and actual performance were steady at a regular output of 400 pieces per week.
Cycle Frame:
During the first week, the actual output was 100% more Therefore, for the second week, the target was fixed to 400 pieces but the output was 600 pieces. Again for the third week the target fixed as 600 pieces and this was just achieved. This shows that initially low target was fixed.
Example:
Write Tor F for true or false against statements listed below in the blank space:
(a) Bar chart defined as a planning and controlling technique developed by Henry Lawrence Gantt, prior to World War I. (F)
(b) Bar Chart is defined as a schedule listing the operations to be carried out on the left hand side of the chart one beneath the other and carrying a time schedule along the horizontal scale. (F)
(c) Bar chart is defined as schedule listing the operations to be carried, out on the horizontal scale one by the side of the other and the time schedule on the left hand, side of the chart one below the other. (T)
(d) Bar chart is defined as a graphical representation of the operations and the time required for the completion of the operations and is drawn in the form of a network diagram. (F)
